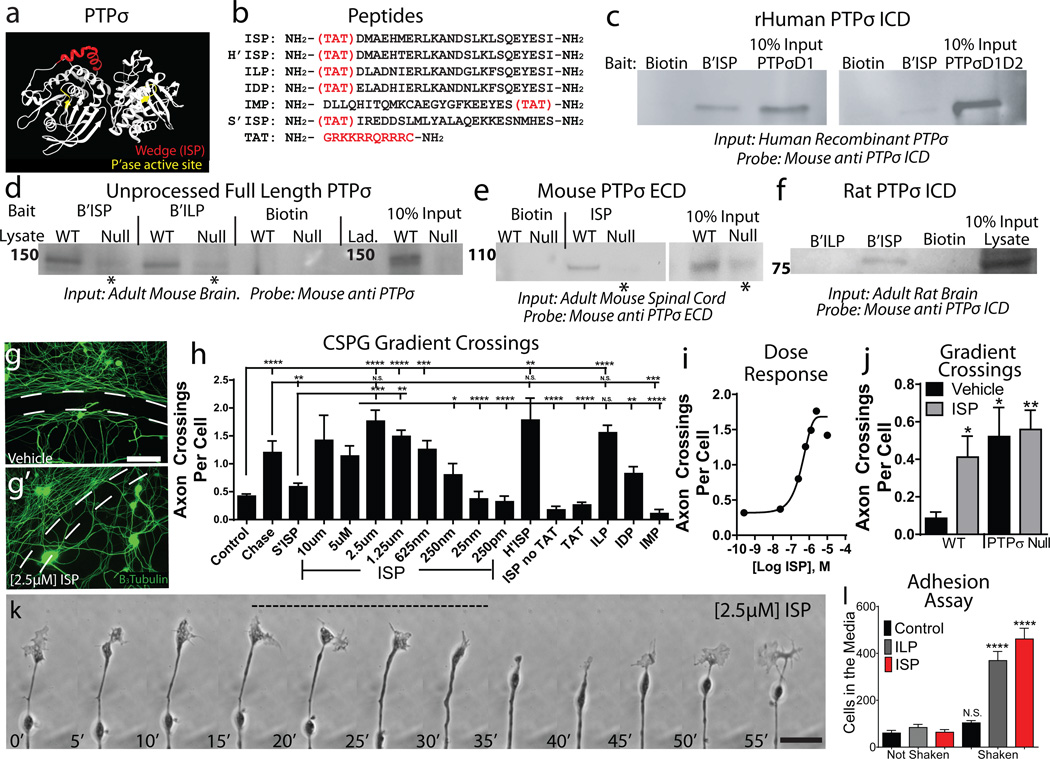
Figure 2. Identification and characterization of ISP.
A: PTPσ structure and wedge domain (red). B: Peptide Sequences. C-F: Pulldown of human, rat and mouse PTPσ with biotinylated ISP. *Nonspecific recognition of PTPδ. G-I: CSPG gradient crossing assay. Dashed Lines=CSPG gradient, scale Bar 50µm, n>16 gradients/group. J: ISP treatment on PTPσ null neurons (n=12/group). K: Time-lapse imaging of an adult sensory neuron growth cone following 2.5µM ISP treatment (Supplementary Video 4).Time-stamp=minutes. Scale bar 20µM. L: The number of neurons released from a CSPG-rich substrate following agitation (n=28 vehicle/ILP, 16 ISP wells/group). Scale bar 50µm. Error bars=SEM, One way ANOVA, Tukey’s post hoc test, *p<.05, **p<0.01, *** p<0.001, *** p<0.0001. Additional sample size information in methods.

