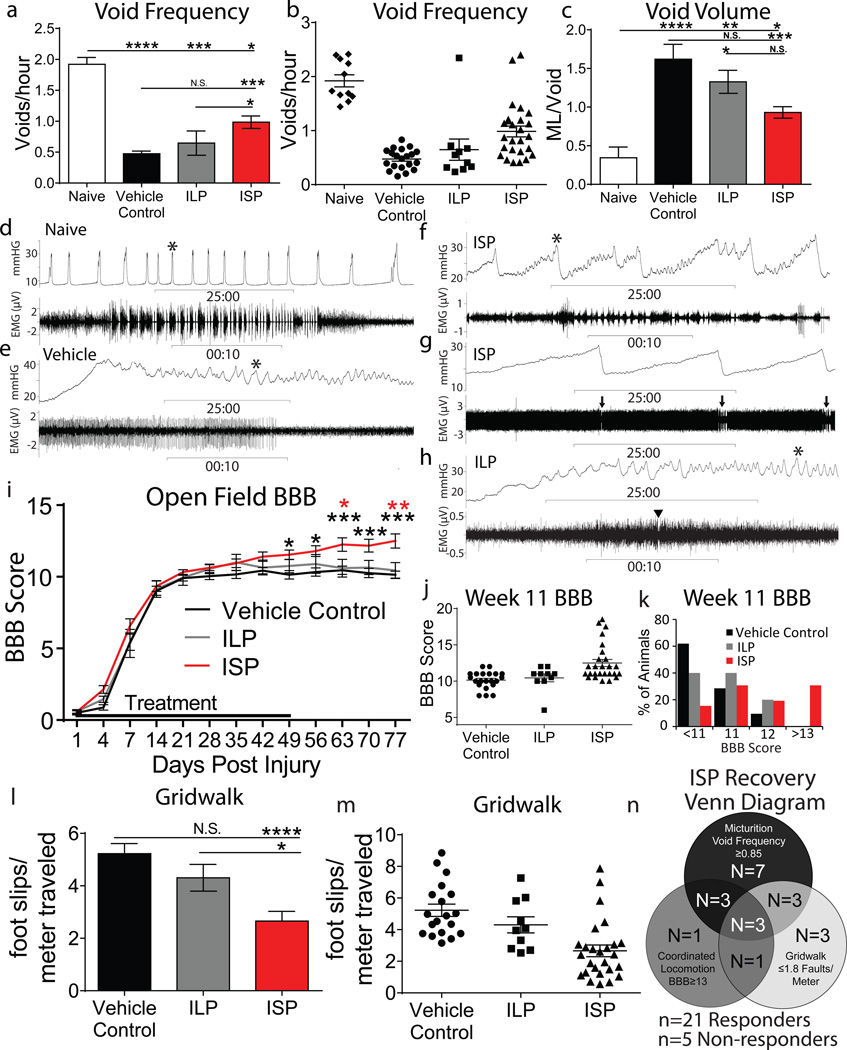
Figure 3. Functional recovery following ISP treatment.
A-C: Void frequency and average void volume at 12 weeks post SCI. D-H: Representative urodynamic recordings of detrusor activity (bladder pressure, top trace) and EUS activity (bottom trace, expanded at *). G: Full trace of EUS activity. Arrow=synchronized phasic bursting. Arrowhead=single burst. I-K: Locomotor recovery (BBB score) following SCI. L-M: Gridwalk test at 12 weeks post SCI. N: ISP functional recovery Venn diagram (21/26 ISP, 0/ 21 vehicle, 1/10 ILP). Error bars=SEM, Repeated measures two-way ANOVA, Tukey’s post hoc test (BBB); one way ANOVA, Kruskal Wallis post hoc test (gridwalk and micturition), *p<0.05, **p<0.01, ***p<0.001, ****p<0.0001, Black: ISP vs Control, Red: ISP vs. ILP.

