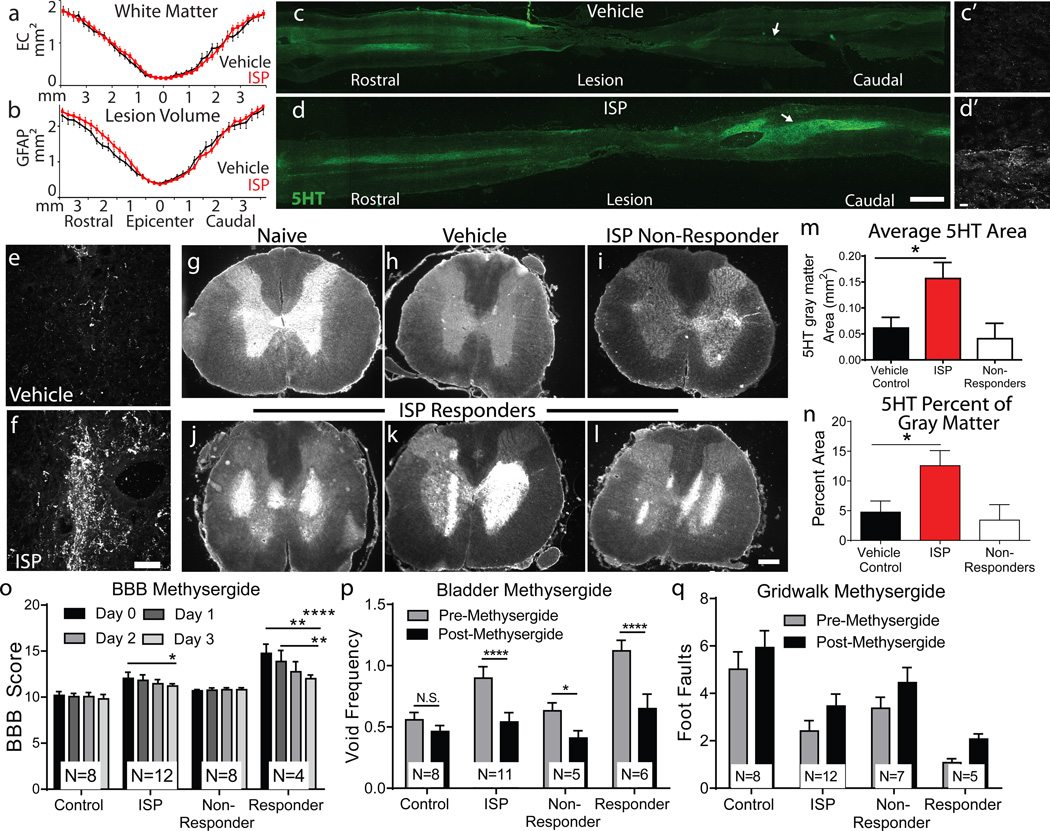
Figure 4. Anatomical changes following ISP treatment.
A-B: Average lesion size (GFAP) and spared white matter (EC) post SCI. n= 9–10 vehicle, 14 ISP. C-D: 5HT intensity in representative longitudinal spinal cord sections. Insets reveal fiber density. Scale bar 2mm, inset 20µm. E-F: Representative confocal projections of caudal 5HT fibers at L1-L3. Scale bar 20µm. G-L: 5HT intensity across lumbar coronal sections. Scale bar 500µm. M-N: Average area and percent coverage of 5HT. n= 13 vehicle, 18 ISP, t-test (two tailed), p<0.05. O-Q: Behavioral response to methysergide at 14 weeks post SCI. Responder=animal demonstrating functional recovery in each behavior. n=8 Vehicle, 11–12 ISP. Error bars=SEM. Two way repeated measures ANOVA, Tukey’s post hoc test (BBB); One way ANOVA, Kruskal Wallis post hoc test (gridwalk and void frequency), *p<0.05, **p<.01, ***p<0.001.

