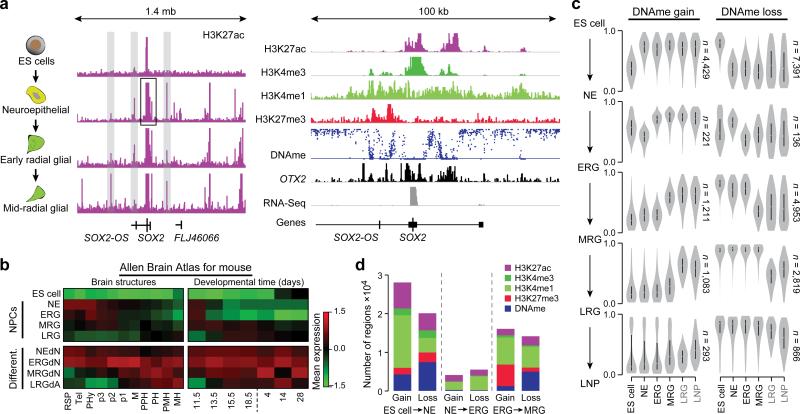
Figure 1. Consecutive stages of ES cell derived neural progenitors are characterized by distinct epigenetic states.
a. Left: Schematic of the cell system. Middle: Normalized read-count level for H3K27ac over a 1.4 mega base (mb) region around the SOX2 locus (chr3:180,854,252-182,259,543). ChIP-Seq read counts were normalized to 1 million reads and scaled to the same level (1.5) for all tracks shown. Right: Additional tracks for H3K4me3, H3K4me1 and H3K27me3 as well as DNAme (scale 0-100%), OTX2 and expression covering a 100 kilo base (kb) sub-region (chr3:181,389,523-181,490,148) of this locus. Histone and RNA-Seq data were normalized to 1 million reads and are shown on distinct scales.
b. Maximum gene set activity levels shown as z-scores for genes expressed in defined brain structures (left) and developmental time points (right) based on the mouse Allen Brain Atlas. Gene set activity was defined as average expression level of all member genes followed by z-score computation across all nine cell types.
Abbreviations: Rostral secondary prosencephalone (RSP), Telencephalon (Tel), peduncular (caudal) hypothalamus (PHy), Hypothalamus (p3), prethalamus (p2), pre-tectum (p1), midbrain (M), prepontine hindbrain (PPH), pontine hindbrain (PH), pontomedullary hindbrain (PMH), medullary hindbrain (MH); and embryonic (E)11.5, E13.5, E15.5, E18.5 as well postnatal P4, P14 and P28.
c. Distribution of DNAme levels for differentially methylated regions (delta meth≥0.2, p≤0.01) across state transitions, For instance, distributions for regions gaining methylation in the transition from ES cell to NE (top left) at all stages of differentiation. Distinct methylation level trace plots are shown for regions gaining methylation (left) during the specific transitions (indicated on the side) and loss of methylation (right). Black labeled samples are based on WGBS data and grey color samples (LRG and LNP) were profiled by RRBS.
d. Barplot of the frequency and associated mark of epigenetic changes for all cell state transitions broken up into gain and loss for consecutive differentiation stages.

