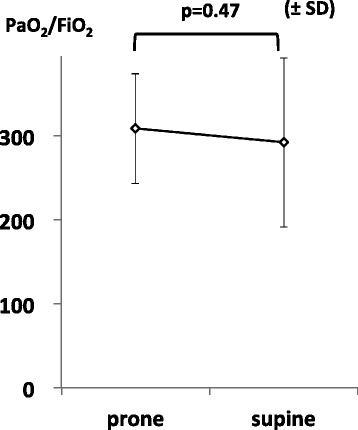
Figure 2.

Mean PFR before and after PP. Paired t-tests were used to compare values among the various time points. Prone represents immediately before completing prone positioning. Supine represents 8 h after completing prone positioning. SD standard deviation.
