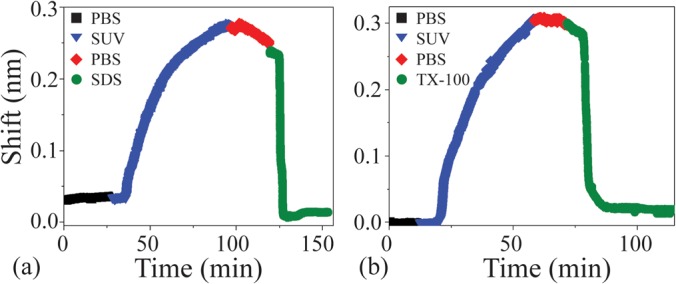
FIG. 2.

The resonant frequency shift due to liposome fusion and bilayer formation of 0.6 mM DOPC is indicated by the blue curve, and subsequent solubilization via (a) 15 mM SDS, and (b) 0.5 mM TX-100 is shown in green. The detergent-initiated solubilization restores the sensor to its original state, exhibiting minimal hysteresis.
