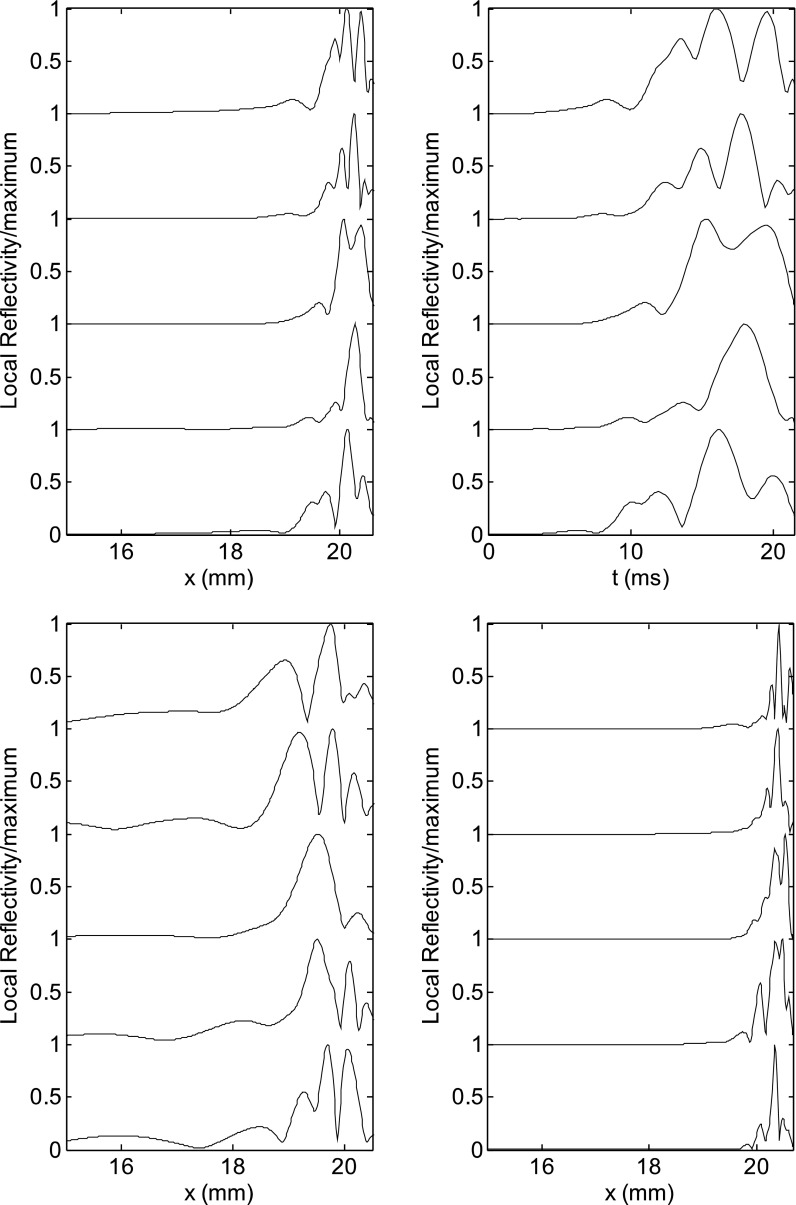
FIG. 2.
(Top left) Magnitude of the local reflectivity density, normalized to its peak value, at 1 kHz, for a Zweig model with Q = 10, for five different roughness patterns (“digital ears”). (Top right) Same function plotted against the delay estimated using Eq. (5), for the same roughness patterns. A small number of peaks are present in most simulations, whose positions (or delays) change with changing the roughness pattern. (Bottom left) For Q = 5, significant contributions come from very basal regions, corresponding to a shift in characteristic frequency of order 1 octave or more. (Bottom right) For Q = 15, most of the reflected power comes from the peak of the response, yet distinct peaks still emerge, because, due to the low group velocity, even short longitudinal displacements may correspond, in the high-Q case, to measurable temporal shifts.

