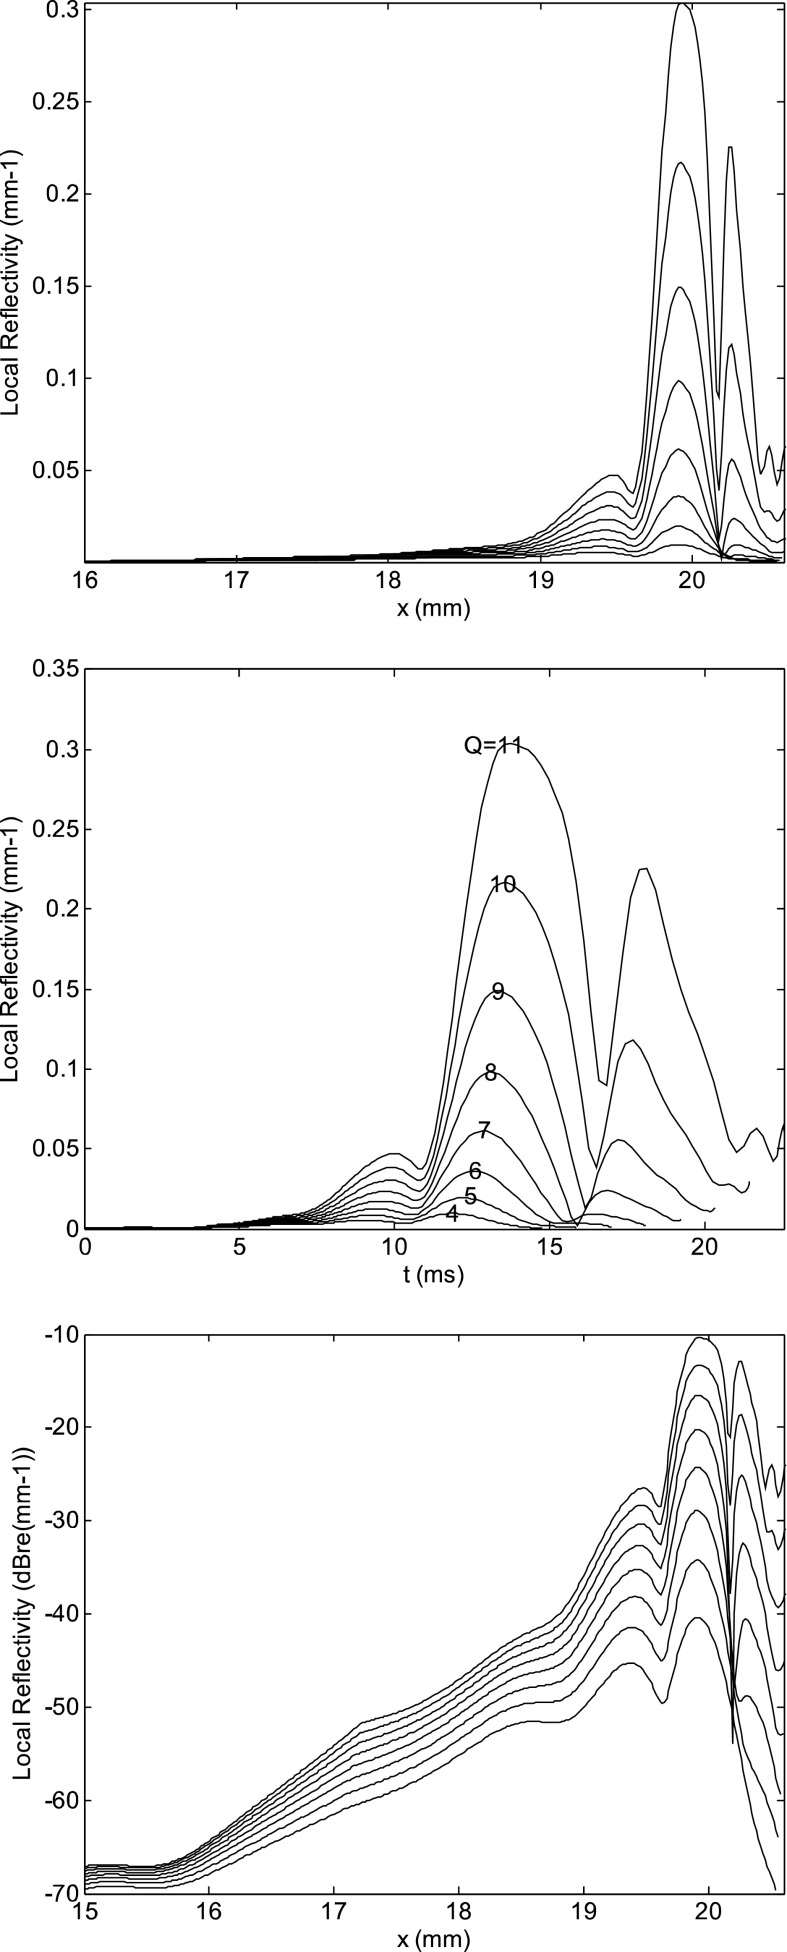
FIG. 3.
(Top) Spatial distribution of the magnitude of the local reflectivity density of Eq. (7) (in linear units) at f = 1 kHz, for models with Q = 4, 6, 7, 8, 9, 10, 11, and the same roughness pattern. The spatial position of the peaks is almost independent of Q, but their relative intensity changes due to the progressive peaking of the underlying displacement basis function. At low Q the most apical peaks disappear. (Middle) Same local roughness reflectivity function, expressed in linear units as a function of the estimated transmission delay, having used Eq. (5) to convert position and frequency into delay. The latency of the most apical peaks rapidly increases with increasing Q. In the experimental bandpass filtered TEOAE data by Goodman et al. (2009), similar delay distributions were observed, but the delay of each peak was rather insensitive of the stimulus level. (Bottom) Same as in the top panel, on a vertical log scale, to better show the different dependence on Q of the different peaks.

