
Figure 2.
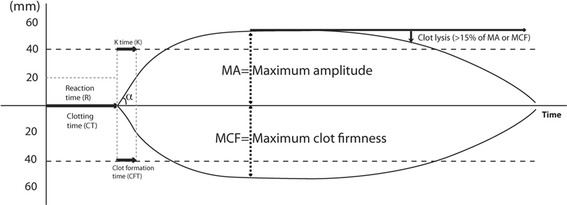
Basic tracing patterns. Changes in whole blood viscoelasticity are detected electromechanically in TEG® and optically in ROTEM®, and clot formation parameters are generated on TEG® (top) and ROTEM® (bottom). Plasmatic coagulation is reflected on R time and CT, initial clot development is shown on K time or CFT (also on α angle), and maximal viscoelasticity is defined by maximum amplitude (MA) or maximum clot firmness (MCF) for TEG® and ROTEM®, respectively. Systemic fibrinolysis is suspected when clot breakdown (>15% of MA or MCF) is observed within 1 h.