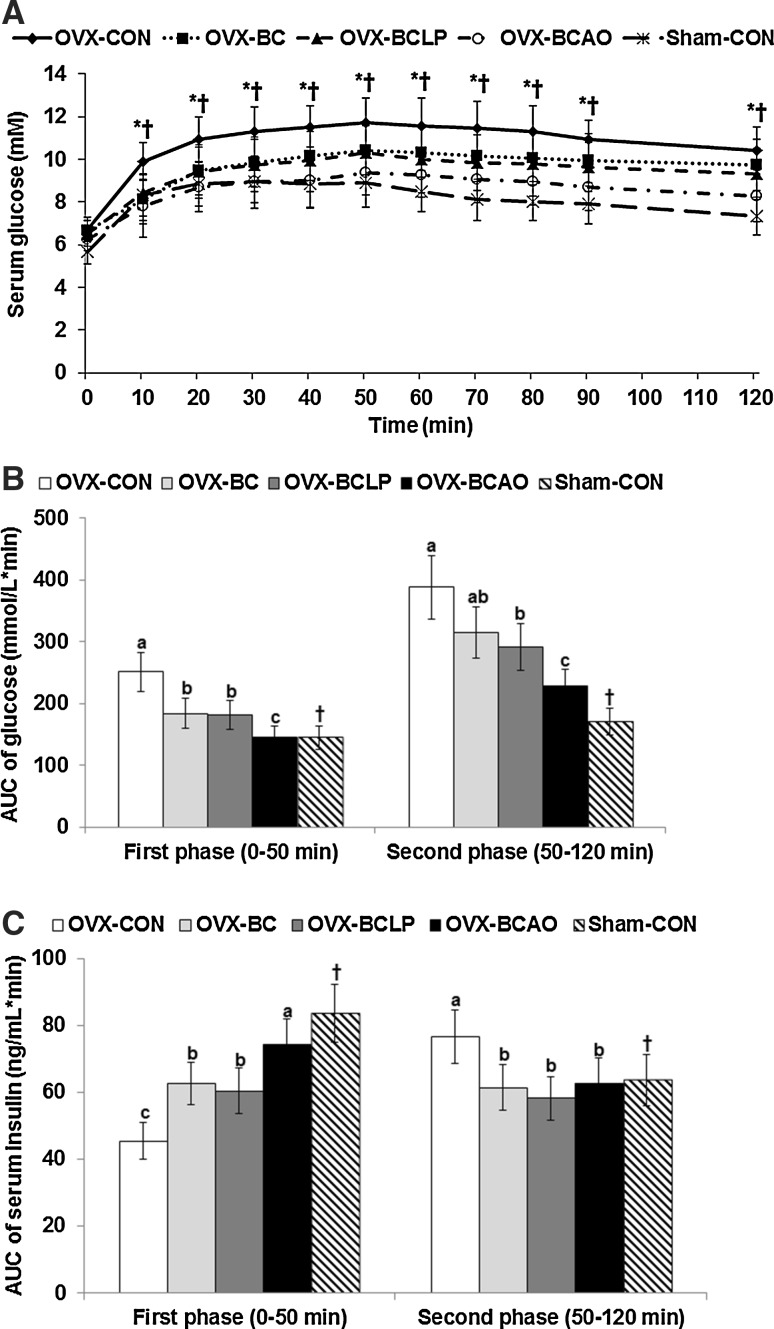
Fig. 2.
Serum glucose levels and area under the curve of glucose and insulin during oral glucose tolerance test (OGTT) at week 11 of experimental periods. OVX-control, OVX rats fed a high-fat diet (HFD) with 2 % dextrin; BC, OVX rats fed HFD with 2 % lyophilized water extracts of black carrot; BCAO, 2 % lyophilized water extract of black carrot fermented with Asperillus oryzae; BCLP, OVX rats fed HFD with 2 % lyophilized water extract of black carrot fermented with Lactobacillus plantarum; Normal-control, Sham rats fed a HFD with 2 % dextrin changes in serum glucose levels were measured during OGTT (a). The average of the area under the curve (AUC) of glucose (b) and insulin (c) during the first part (0–40 min) and second part (40–120 min) of OGTT. Each dot and bar represents the mean ± SD (n = 10). *Significantly different among the treatment groups of OVX rats at P < 0.05. a,b,cDifferent superscript letters indicate significant differences among OVX rats by Tukey’s test at P < 0.05. †Significantly different between the OVX-CON and Sham-CON groups by two-sampled t test at P < 0.05

