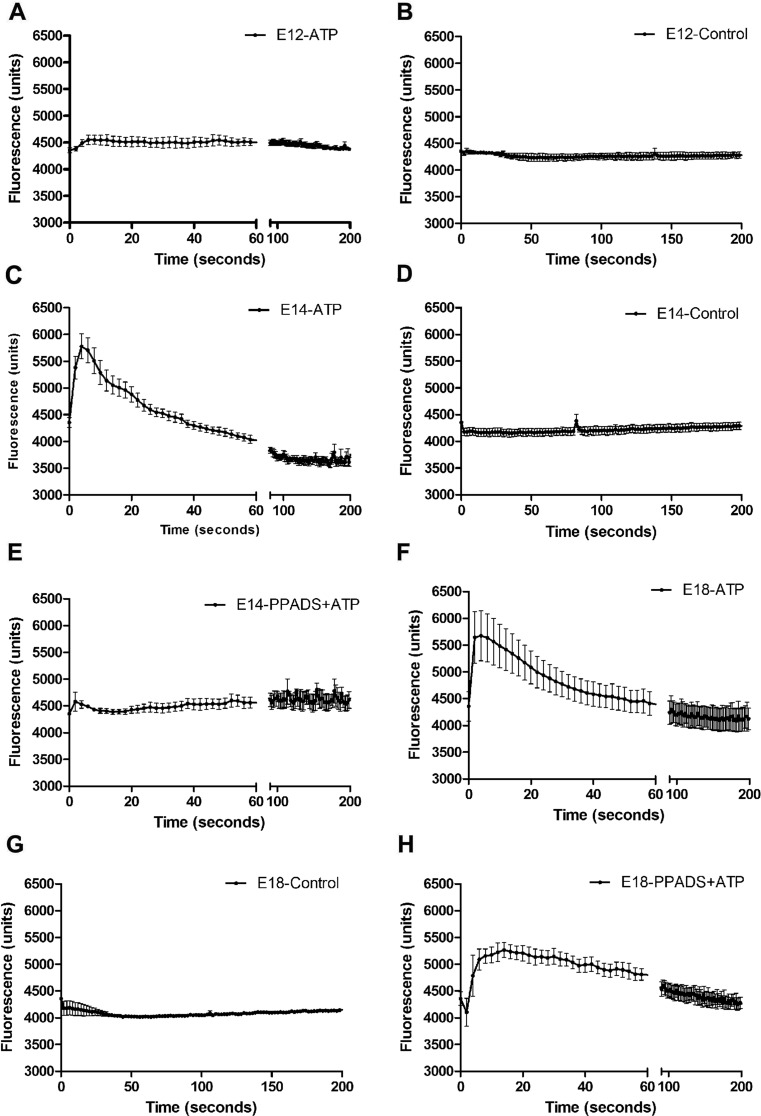
Fig. 1.
Ca2+ mobilization in embryonic cardiomyocytes using FLIPR. The response of Ca2+ mobilization is represented by an increase in fluorescence. Responses of ATP (100 μM) in cultured cardiomyocytes taken from E12 (a), E14 (c) and E18 (f) and the corresponding controls (b, d, g, respectively). e, h The ATP-induced response after pre-incubation with PPADS (30 μM). Representative tracings from three independent experiments are shown performed with three different embryos each day of experiment

