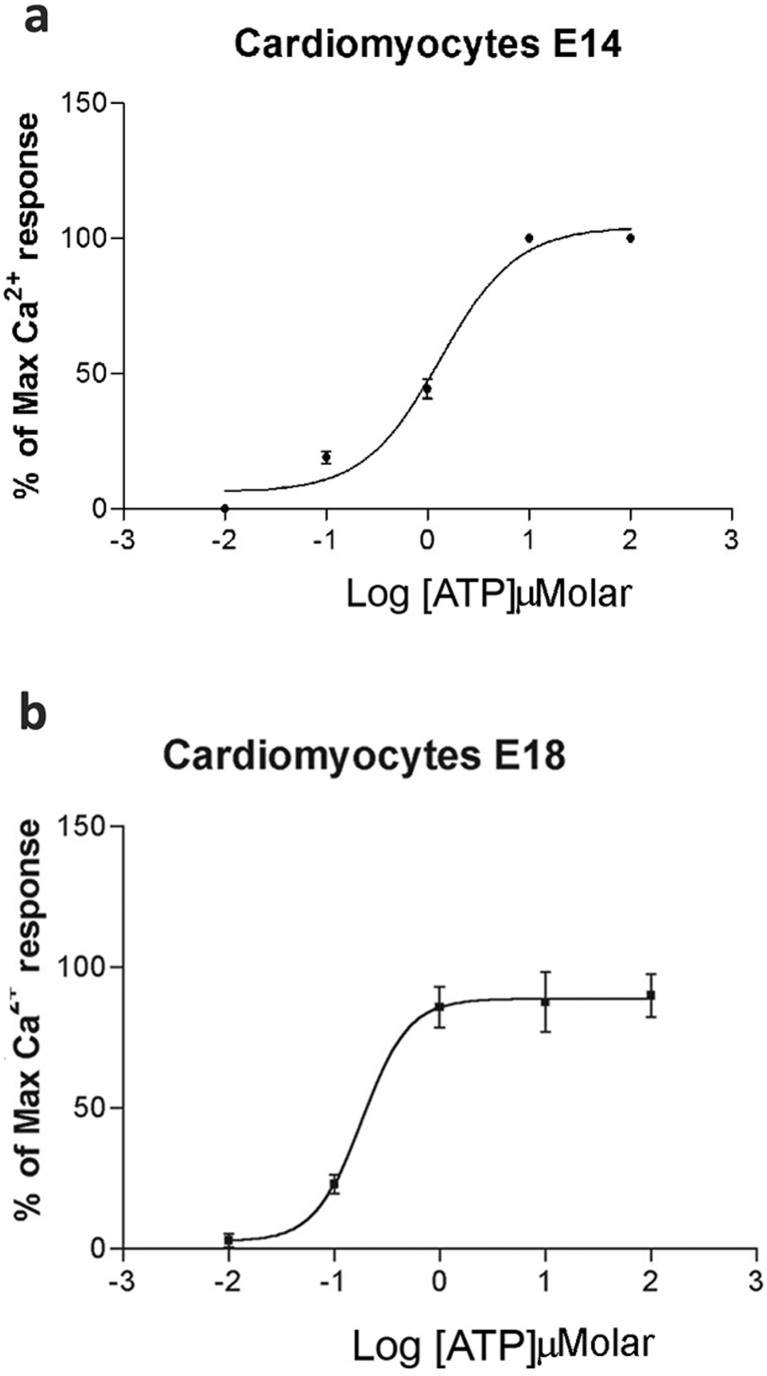
Fig. 2.
Dose-response curves to ATP of embryonic cardiomyocytes. Ca2+ mobilization responses to increasing ATP concentrations using fluorescence photometry. ATP-induced responses in cultured cardiomyocytes taken from E14 (a) and E18 (b). Mean of at least three independent experiments, with at least three different embryos each day of experiment, with 20–30 cells/field

