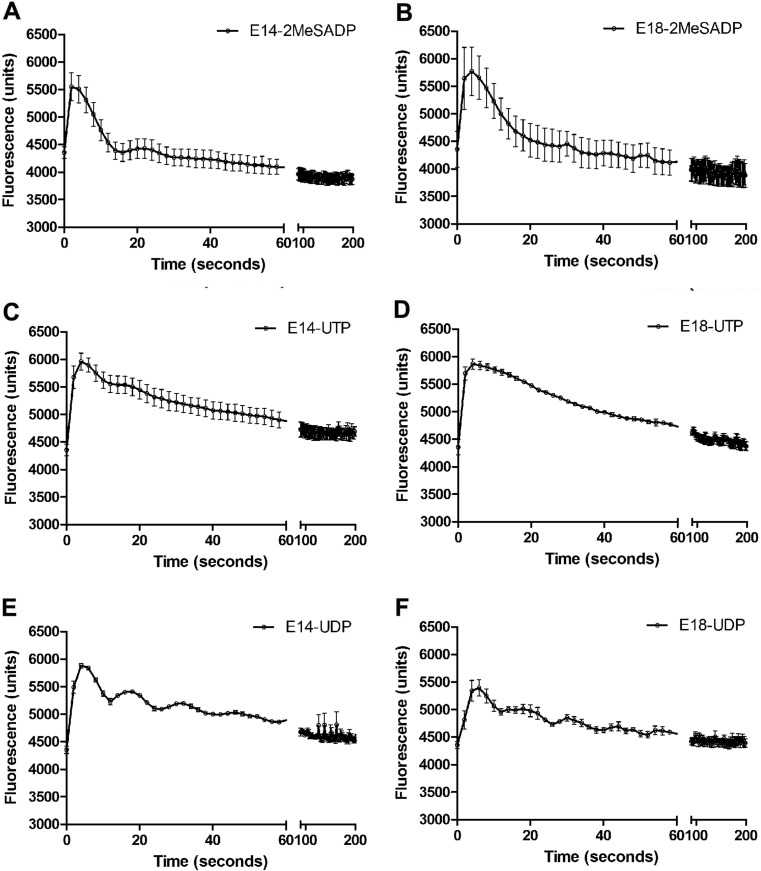
Fig. 4.
Ca2+ mobilization of embryonic cardiomyocytes using FLIPR. The Ca2+ mobilization responses are represented by an increase in fluorescence. a, c, e Responses of E14 cardiomyocytes induced by 2-MeSADP, UTP and UDP (100 μM), respectively; b, d, f Responses of E18 cardiomyocytes induced by the same agonists. Representative tracings from three independent experiments are shown performed with three different embryos each day of experiment

