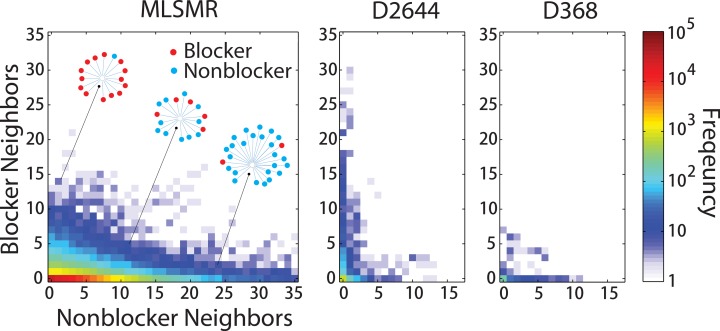
Fig 2. Continuity of structure variants between blockers and nonblockers in the MLSMR and previous hERG datasets.
Each dataset is represented by a structure network as described in Fig. 1. Compound neighbors are classified as blocker (>50% hERG Inhibition at 10 μM) and nonblocker (<50%). The frequency of compounds with a given number of blocker and nonblocker neighbors in each dataset is plotted, with white cells representing empty data, and the origin representing singleton compounds with no neighbors. Grid points along the vertical axis (horizontal axis) represent compounds with a majority blocker neighbors (nonblocker neighbors). The region along the diagonal represents the transition zone where compounds possess mixed blocker and nonblocker neighbors. This transition zone is illustrated by three example neighborhoods containing blockers (red nodes) and nonblockers (light blue nodes).

