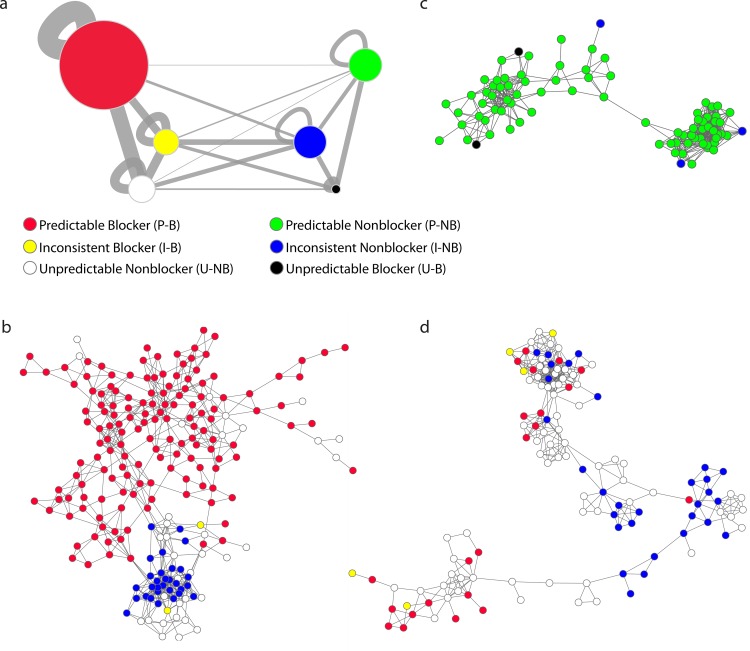
Fig 4. Structural similarity within and between six populations of compounds in the MLSMR assigned by activity-predictability classes.
(a) Summary network visualizing the relationships of six possible combinations of activity (blocker and nonblocker) and predictability (predictable, inconsistent and unpredictable) classes. Each node represents the population of compounds of the same activity-predictability assignment, with edge width representing relative structural similarity quantified by relative connection density (see Methods), within and between each population using the structure network defined in Fig 1. Node sizes for P-B, I-B and U-B represent enrichment of blockers among compounds with high, intermediate, and low hBS compared to the distribution of the entire dataset. Similarly, P-NB, I-NB and U-NB sizes represent enrichment of nonblockers among compounds with low, intermediate, and high hBS. (b) An example cluster that highlights connection patterns within and between P-B, U-NB and I-NB compounds. (c) An example cluster that highlights connection patterns within and between P-NB, U-B and I-NB compounds. (d) An example cluster in which inconsistent and unpredictable compounds are more pronounced. Networks are generated using Cytoscape 2.8.2.

