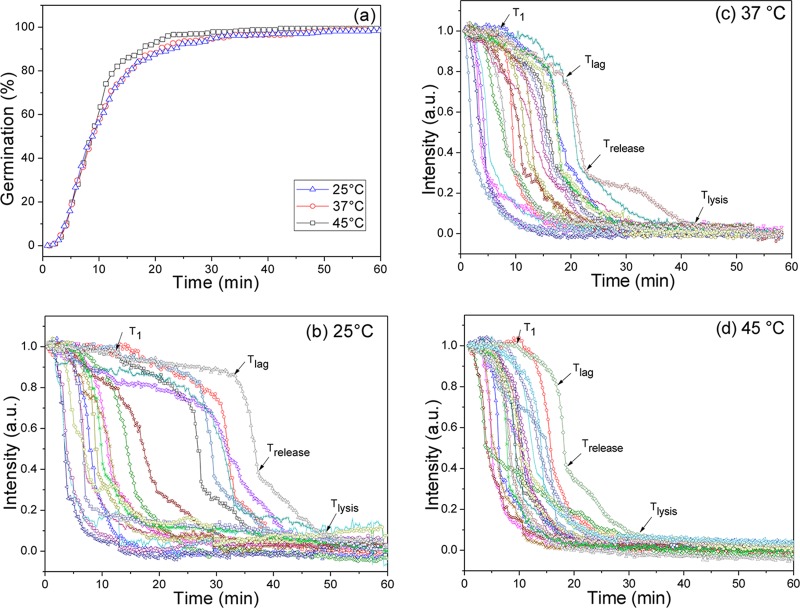
FIG 5.
Germination extents (a) and PC image intensities of multiple individual B. subtilis PS3411 (↑SpoVA) spores germinating with l-valine at various temperatures. PS3411 spores were germinated with 2 mM l-valine at various temperatures, and spore germination was monitored by PC image intensity changes as described in Materials and Methods. The phase-contrast image intensities (a.u.) were normalized to 1 based on the respective values at the first time of measurement, and PC image intensities at the end of the experiment were set at 0. The arrows indicate the times of T1, Tlag, Trelease, and Tlysis for a single spore. In panel a, the germination curves at the different temperatures are from data with >323 spores each, and a germinated spore was defined as one that had reached Trelease.

