
Figure 3.
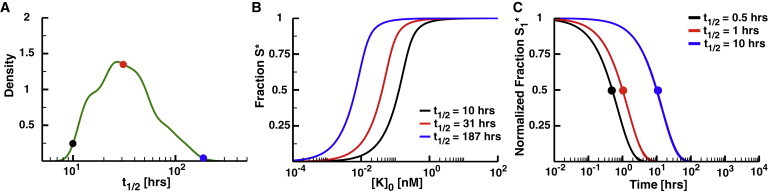
Degradation as a phosphatase. (A) The range of signaling protein half-lives in mouse C2C12 cells (35). The minimum reported half-life is 10 h (black dot), maximum is 187 h (blue), and median is 31 h (red). (B) The fraction S∗ as a function of the concentration of active kinase, [K]0. Note that the model for these panels includes only the kinase and degradable substrate. [K]0 directly affects the parameter rdeg, which represents the ratio of the maximum velocity of the kinase to the maximum velocity of degradation (kdeg×[S]0). The value of rdeg will thus change for a constant concentration of kinase as the half-life changes. As such, any rdeg for a protein with a longer half-life will involve a lower concentration of kinase than that for a protein with a shorter half-life. (C) The normalized fraction S∗ as a function of the time after setting kinase activity to 0 for substrates with half-lives of 0.5, 1, and 10 h. To see this figure in color, go online.