
Figure 2.
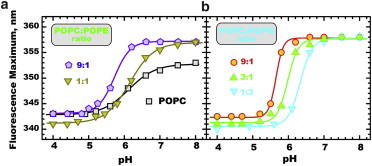
Fluorescence spectral maximum changes upon pH titration of 2 μM pHLIP in the presence of LUVs of various compositions (1 mM total lipid). The experimental data were fitted to Eq. S1 in the Supporting Material (solid lines) and the resulting fitting parameters are summarized in Table S1. To see this figure in color, go online.