
Figure 1.
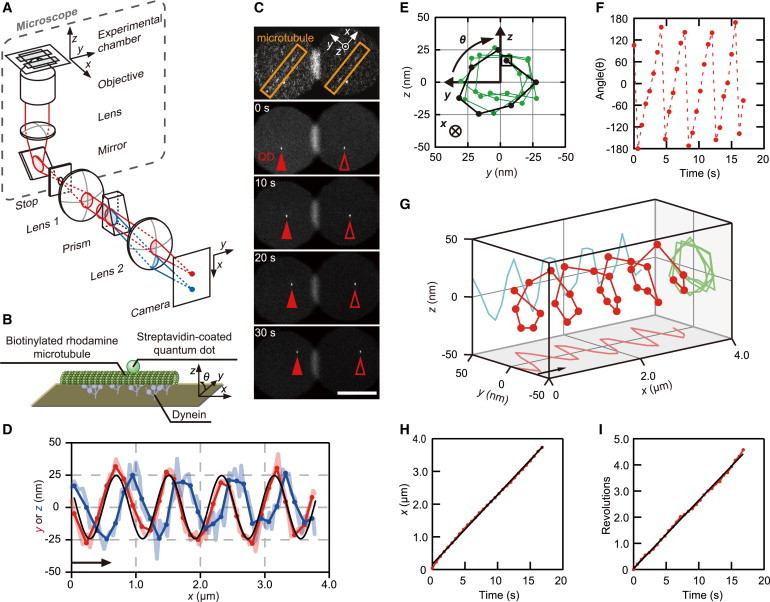
Quantification of the corkscrew motion of a sliding microtubule driven by three-headed outer-arm dyneins (αβγ) using 3D tracking microscopy. (A) A schematic illustration of the tPOT setup. The beam flux focused by lens-1 outside the camera port of the microscope is split in two by the prism located at an eBFP of the objective. One half-beam of the light passes through the center of lens-2 (red), whereas the other half, refracted by the prism, passes below the center (blue). Two split beam images were formed on the camera chip with lens-2. (B) Diagram of the in vitro microtubule corkscrewing assay during 3D measurement. The sparsely biotinylated, rhodamine-labeled microtubule with a QD (λ = 525 nm) attached is sliding and rotating driven by Tetrahymena dyneins anchored to nonspecifically the glass surface. θ is the rotational angle of the QD around the microtubule’s longitudinal axis. (C) Sequential images of the microtubule-attached QD observed under the tPOT microscope. The top image shows a rhodamine-labeled microtubule, whereas the others show a QD attached to the translocating microtubule. The solid and open arrowheads indicate the images split by the prism of QD bound to the microtubule, respectively (time in seconds). Scale bar, 10 μm. (D) The x-y (red) and x-z (blue) trajectories of the QD bound to a microtubule shown in (C). The rotational pitch was determined by fitting the x-y position of the QD with a sine function (back line), yielding a value of 0.81 μm. The handedness of the rotation was checked by combining the x-y trajectory with the x-z trajectory of the QD, because the phase of sinusoidal oscillation of the two traces shifted with a quarter of the wavelength as the sliding microtubules rotated around their longitudinal axis. Images were recorded at 0.2 s intervals (light red and light blue lines), and three images were averaged (red and blue solid lines). The arrow indicates the approximate displacement during 3 s. (E) The y-z trajectory of the QD bound to the microtubule shown in (C). The trajectory of the first revolution is shown by the black line and begins at the open square. The trajectory shows clockwise rotation of the sliding microtubule when looking in the direction of forward translocation. (F) The angle of rotation on the y-z plane as shown in (E) was plotted against time. The angle (θ) in every rotation increased, indicating a right-handed corkscrew motion in the xyz axes defined here. (G) 3D plot of the QD shown in (D) reveals clockwise rotation of the sliding microtubule. The arrow indicates the approximate displacement during 3 s. (H) Time course of x-displacement of the QD shown in (D). (I) Time course of revolution of the QD is shown in (D). Revolutions were obtained by shifting the values after each full rotation by 360° shown in (F).