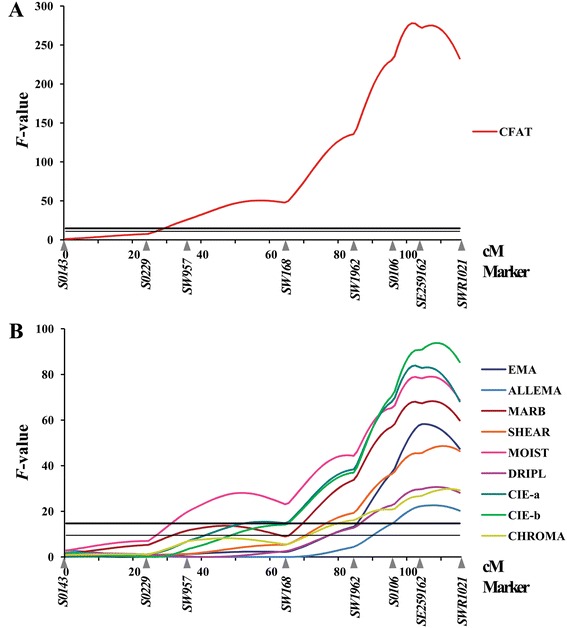
Figure 1.

QTL profiles for meat quality related traits on SSC12. The y-axis represents the F-value testing the hypothesis of a single QTL on a given position on the chromosome. The marker map with genetic distance between microsatellite (MS) markers in Kosambi cM is given on the x-axis. The thick horizontal line indicates the 1% genome-wide significant threshold and thin horizontal line indicates the 5% chromosome-wide significant threshold. Trait abbreviations are in Table 1. (A) QTL profile for CFAT. (B) QTL profiles for EMA (eye muscle are), ALLEMA (EMA area and spinalis dorsi muscle), MARB (marbling score in EMA), SHEAR (shear force), MOIST (moisture percentage), DRIPL (drip loss), CIE-a (meat color red/green), CIE-b (meat color yellow/blue), and CHROMA (meat color chroma).
