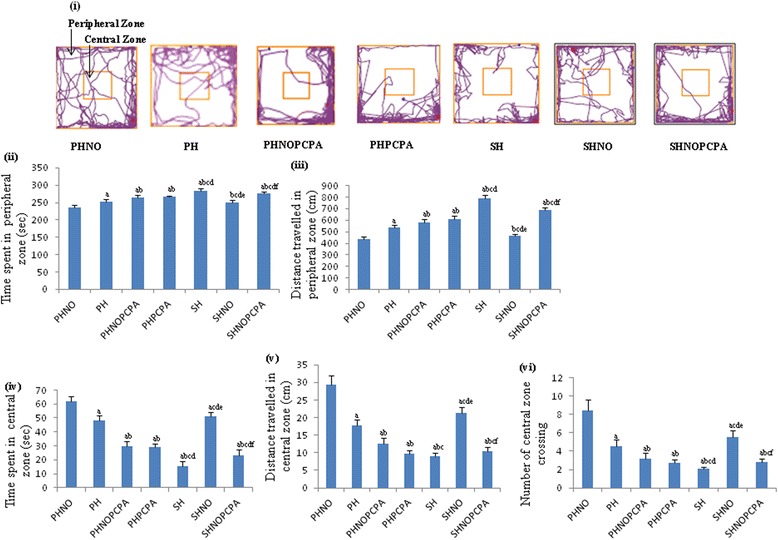
Figure 1.

Open field test. i) Representative tracksheets of open field test and graphs showing alterations in (ii) time spent in peripheral zone, (iii) distance travelled in peripheral zone, (iv) time spent in central zone, (v) distance travelled in central zone and (vi) number of central zone crossing following exposure to monotony stress, PCPA administration and novel object intervention during isolation. Values are expressed as mean ± SEM. ‘a’ denotes p ≤ 0.01 when compared to PHNO group, ‘b’ denotes p ≤ 0.01 when compared to PH, ‘c’ denotes p ≤ 0.01 when compared to PHNOPCPA group, ‘d’ denotes p ≤ 0.01 when compared to PHPCPA group and ‘e’ denotes p ≤ 0.01 when compared to SH group and ‘f’ denotes p ≤ 0.01 when compared with SHNO group.
