
Figure 6.
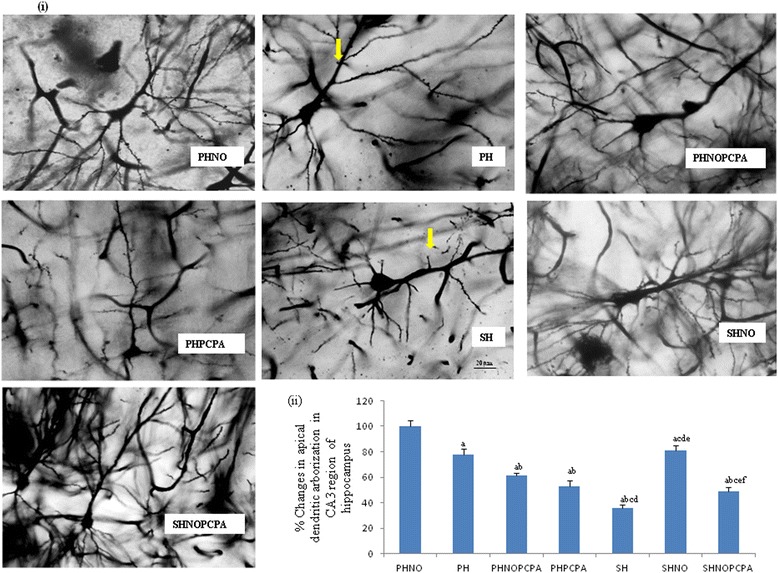
Golgi-cox staining. i) Representative micrographs of Golgi-cox staining showing dendritic arborization in the CA3 region of the hippocampus. Arrow heads depict loss of dendritic arborization. Scale bar-20 μm. Magnification-40X. ii) Graph showing percentage changes in apical dendritic arborization in CA3 region of the hippocampus following exposure to monotony stress, PCPA administration and novel object intervention during isolation considering mean value of PHNO group to be 100%. Values are expressed as mean ± SEM. ‘a’ denotes p ≤ 0.01 when compared to PHNO group, ‘b’ denotes p ≤ 0.01 when compared to PH, ‘c’ denotes p ≤ 0.01 when compared to PHNOPCPA group, ‘d’ denotes p ≤ 0.01 when compared to PHPCPA group and ‘e’ denotes p ≤ 0.01 when compared to SH group and ‘f’ denotes p ≤ 0.01 when compared with SHNO group.