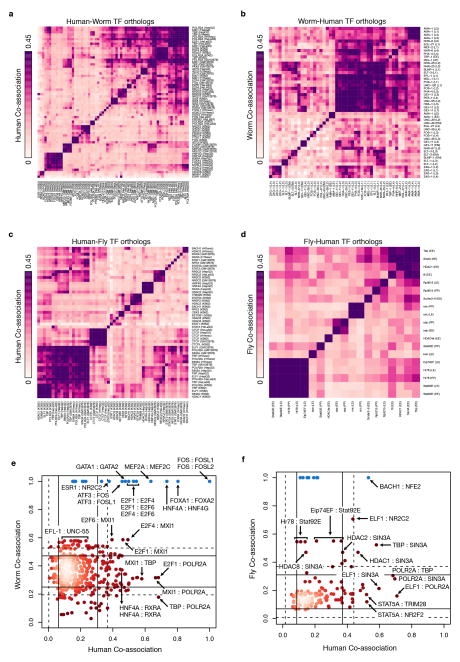
Extended Data Figure 9. Co-associations.
Evolutionary retention and change in TF co-associations. The pairwise co-association strengths between orthologous TFs are shown for human-worm orthologs (a, b) and human-fly orthologs (c, d). For each pair of species-specific orthologs across multiple samples, the co-association strength, measured as the fraction of significant co-binding events between experiments, is shown (IntervalStats32). (a) Human co-association matrix for human-worm orthologs. (b) Worm co-association matrix for human-worm orthologs. (c) Human co-association matrix for human-fly orthologs. (d) Fly co-association matrix for human-fly orthologs. (e) Comparison of human-worm TF ortholog co-associations. The co-association strength of human-worm orthologs in human (x-axis) is plotted against the co-association strength in worm (y-axis). Lines depict 1 (solid) and 1.5 (dashed) standard deviations from the mean score. Factors in blue represent enrichments due to paralogous TFs in human that tend to be highly co-associated. (f) Comparison of human-fly TF ortholog co-associations. Co-association strength in human (x-axis) is plotted against co-association strength in fly (y-axis). For TF orthologs assayed in multiple developmental stages/cell-lines, the maximal co-association between contexts was selected for the comparative analyses (e, f).

