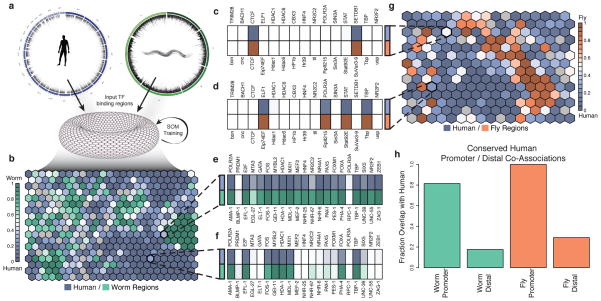
Figure 4. TF co-association.
Many instances of TF co-association are under very specific contexts and are likely not observed in a simple genome-wide co-association study. (a) We combined the patterns of orthologous factors and genomic regions from two organisms to train a SOM where each ‘hexagon’ contains genomic regions from either organism with the same binding pattern of orthologous factors for worm (b) and fly (g). Each hexagon is shaded by the frequency of the pattern in the pairs of organisms. We show an example of binding patterns of 4 hexagons from the human-fly (c–d) and the human-worm (e–f). Names above the heatmaps are human factor names while those below are their ortholog names. Dark shaded boxes indicate binding of that factor. (c) A binding pattern shared at equal frequency between human and fly with only CTCF and SETDB1 (CTCF and SuVar3-9 in fly) binding. (d) A binding pattern that occurs more frequently in human shows ELF1, RNA Pol II, STAT, and TBP binding. (e) A binding pattern at similar frequencies in human and worm that is an example of a HOT region. (f) A pattern more frequent in humans than worms shows RNA Pol II, E2F, FOS, MYBL2, HDAC1, MXI1, FOXA, and TBP binding. (h) Co-localization patterns that occur more frequently near promoters (<500bp) in humans are highly likely to also occur at promoters in worm (80%) and fly (100%).

