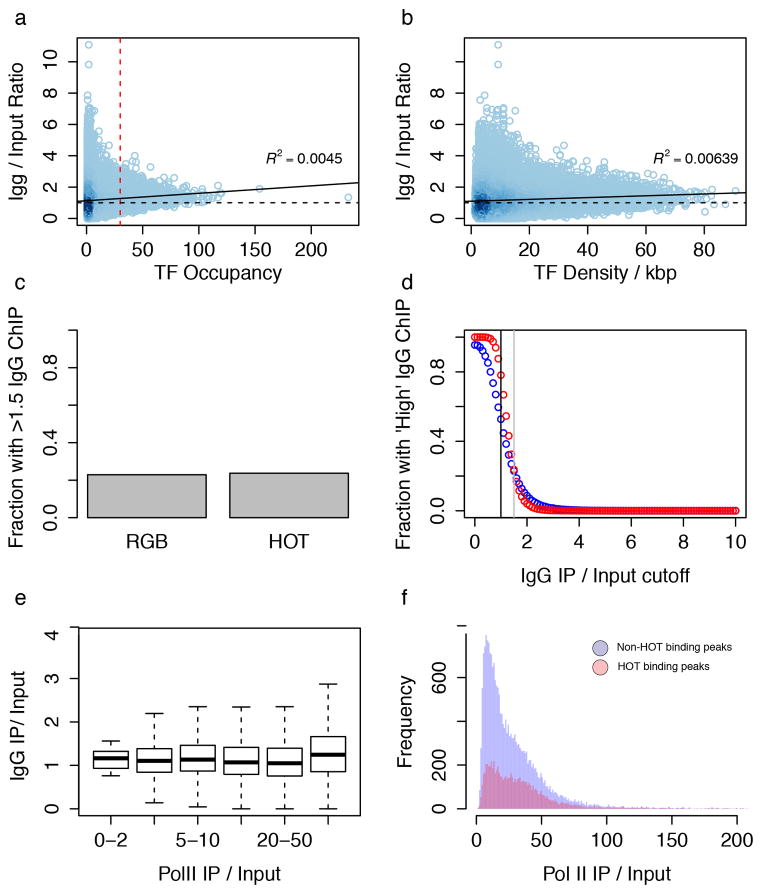
Extended Data Figure 5. Human HOT enrichments are not overly enriched for control DNA.
HOT regions do not represent assembly or ChIP-ability artifacts. (a) Scatter plot of IgG IP/Input vs TF Occupancy. Scatterplot is shaded by density of points. Red dash line represents HOT threshold and black dashed line represent an enrichment of 1x. Black line represents best fitting line to the scatter plot (R2 = 0.0045) (b) A scatterplot of density (number of TF peaks per kb) rather than total number of peaks in a region shows a similar trend. (c) Barplot of fraction of regions with high IgG enrichment for HOT and non-HOT (RGB) regions using the same threshold (1.5x) as Teytelman et al. Figure 7 reveals little similarity between HOT regions and artifact ChIP regions. (d) The fraction of HOT (red) and non- HOT (blue) regions with high IgG enrichment is plotted as a function of threshold. Black line represents no enrichment (IgG/Input = 1x) and grey dashed line represents the enrichment cutoff (1.5x) used in (b) and in Teytelman et al. Figure 7. (e) Comparison of IgG (IgG/Input) and RNA Pol II enrichment (RNA PolII/Input) shows a different trend from Teytelman et al. Fig 3a. (e) Nearly all (99.967%) of our uniformly processed RNA PolII binding sites have IP/Input rations >2x, with a median enrichment of ~20x.

