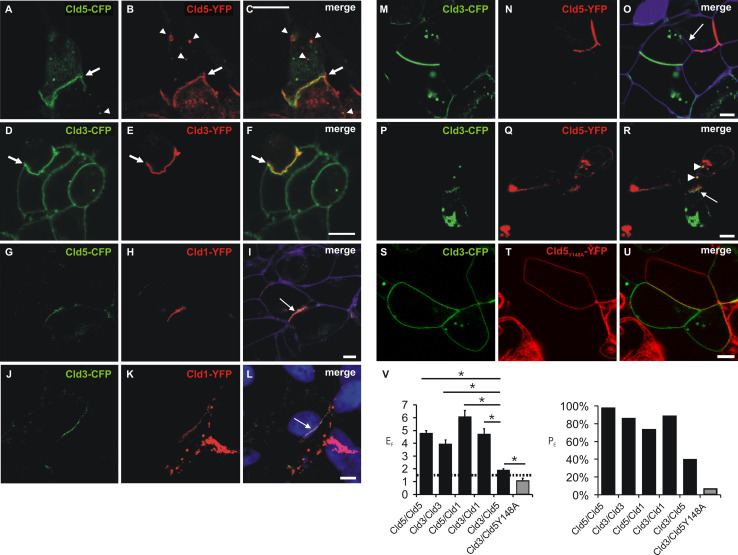
Fig. 3.
Heterophilic trans-interaction between claudins. Confocal microscopy of cocultures of cells monotransfected with Cld5-CFP/Cld5-YFP (a–c), Cld3-CFP/Cld3-YFP (d–f), Cld5-CFP/Cld1-YFP (g–i), Cld3-CFP/Cld1-YFP (j–l), Cld3-CFP/Cld5-YFP (m–r), or Cld3-CFP/Cld5Y148A-YFP (s–u). CFP- (green) and YFP- fluorescence (red) was imaged (a–u) and, partly, the plasma membrane visualized with trypan blue (i, o; violet) or nuclei stained with DAPI (l, blue). Strong colocalization and coenrichment of claudins at cell contacts (arrows) was detected at homologous (Cld5/Cld5, a–c, Cld3/Cld3, d–f) and heterologous cell contacts for Cld1/Cld5 (g–i) and Cld1/Cld3 (j–l). At contacts between Cld3- and Cld5-expressing cells, coenrichment was found to be weaker and less frequent (example without (m–o, arrow) and with (p–r, arrow) coenrichment). Cld3-CFP containing vesicles (r, arrow heads) were detected in Cld5-YFP-expressing cells similar as Cld5-YFP containing vesicles (a–c, arrow heads) in Cld5-CFP-expressing cells and vice versa. At contacts between Cld3- and Cld5-Y148-expressing cells, no coenrichment was found (s–u). v Quantification of contact coenrichment. For Cld5/Cld5, Cld3/Cld3, Cld1/Cld3 and Cld1/Cld5 the factor of contact enrichment (E F) was significantly higher than for Cld3/Cld5 and for Cld3/Cld5 than for Cld3/Cld5Y148A that showed E F similar to the negative control (Fig. 1). Similar differences were obtained for percentage of contacts with enrichment (PE). Bar, 5 μm. *p < 0.01; n ≥ 35; mean + SEM; dotted line, threshold above trans-interaction is considered

