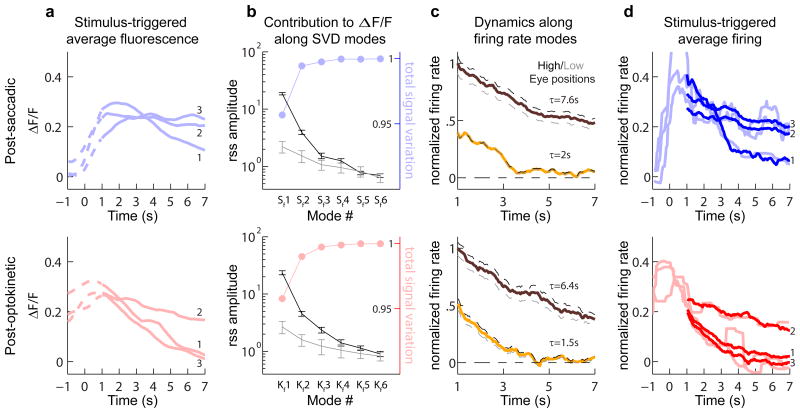
Figure 3. Mode analysis of responses during post-saccadic (top) or post-optokinetic (bottom) fixations.
(a) Stimulus-triggered average fluorescence responses (ΔF/F) for three cells (numbered 1 through 3) during saccadic and optokinetic eye movements. Time zero corresponds to the end of the stimulus. Solid lines represent the analyzed portion of the fixation period. (b) Singular values of the stimulus-averaged responses (black), which give the root-sum-square (rss) amplitudes of each fluorescence component. These are compared to the average rss amplitudes from noise (gray). Error bars give the 90% confidence intervals. Colored dots indicate the cumulative sum of the fractional signal variation explained (c) Projection of population firing rates (normalized) along the primary (brown) and secondary (yellow) firing rate modes (S1, S2, K1 and K2). Dashed lines show projected firing at high (black) and low (gray) eye positions. (d) Deconvolution of average fluorescence data from a gives firing rates corrupted by noise (light lines, smoothed with a 1 second moving median filter, MATLAB medfilt1), while deconvolution after using the singular value decomposition to separate signal from noise gives firing rates that better capture the underlying dynamics (thick lines).

