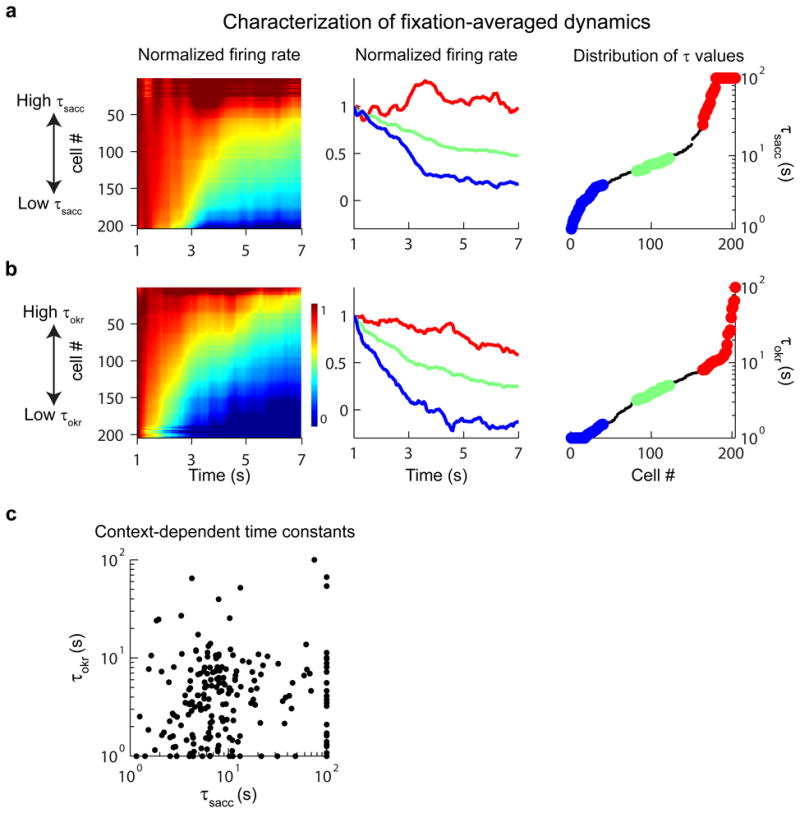
Figure 4. Dynamics of persistent firing during (a) post-saccadic and (b) post-optokinetic fixations.

(Left) Normalized firing rate responses of individual cells. Cells were sorted separately for each context according to relaxation time constant. (Middle) Firing rates of the least (blue), middle (green) and most (red) persistent 20% of cells. (Right) Distribution of the time constants of persistent firing for the population. (c) A cell-by-cell comparison of relaxation time constants from post-optokinetic (τoptokinetic) vs. post-saccadic (τsaccadic) fixations. Note that, for ease of visualization of the majority of the data, time constants outside the range 1-100 seconds were plotted at the closest corresponding edge.
