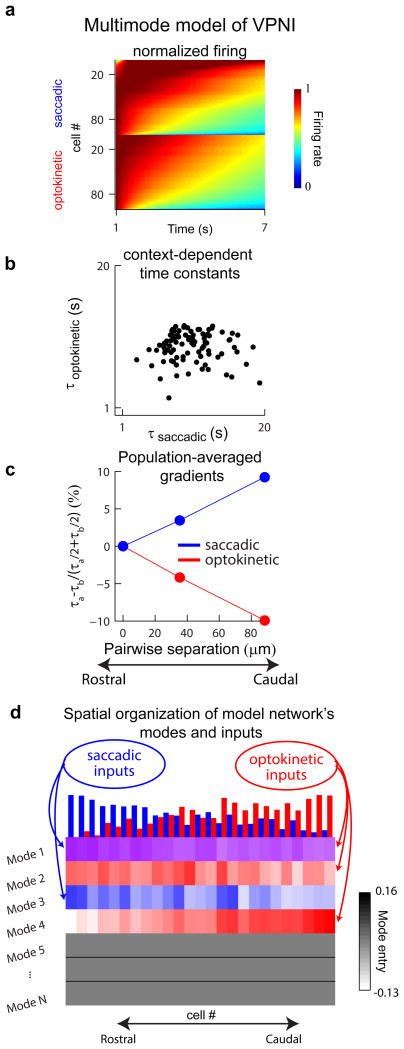
Figure 7. Multimode model of the VPNI that captures the experimental results.
(a) The normalized firing rates during fixations following saccadic (top) or optokinetic (bottom) stimulation in a model of the VPNI with multiple modes of persistent activity. Cell indexing was arranged by persistence time constant in each context. (b) Direct cell-by-cell comparison of the time constants of persistent firing, τsaccadic and τoptokinetic. (c) Gradients along the rostro-caudal axis of the simulation. (d) Smoothed values of the entries for modes 1 through 4 (rows 1 through 4) arranged according to the rostro-caudal axis of the stimulation. For each mode, smoothing was done by computing averages over 15 bins moving along the rostro-caudal axis. The normalized strengths of the inputs are indicated by the bar heights at the top of the panel, and the value of a mode entry is indicated by the color intensity (red: receives optokinetic input only; blue, receives saccadic input only; purple, receives both optokinetic and saccadic input).

