Figure 3.

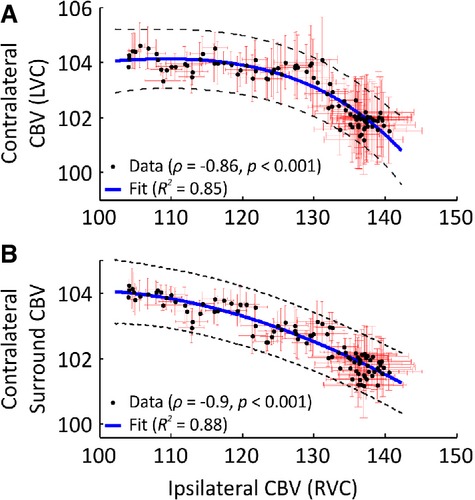
Tight relationship between bilateral CBV responses during 4-AP–induced recurrent seizures. (A) Comparison of averaged CBV responses (n = 5), ipsilateral (RVC), and contralateral (LVC) to SOZ showing a nonlinear negative correlation (Spearman's ρ = −0.86, p < 0.001). Exponential regression line (blue) fitted using nonlinear least squares (R2 = 0.85). (B) Nonlinear negative correlation between averaged CBV responses (n = 5) in RVC and contralateral surround region (Spearman's ρ = −0.9, p < 0.001). Best-fit exponential regression line (blue) applied as above (R2 = 0.88). Dashed black lines denote 99% confidence bounds. Red error bars are SEM.
