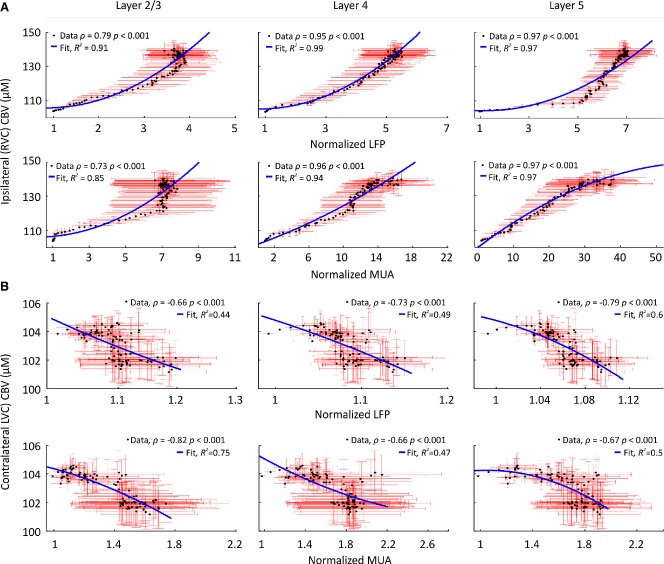
Figure 4.
Altered neurovascular coupling in RVC and LVC during recurrent seizures in RVC. (A) Significant nonlinear correlation between averaged (n = 5) CBV responses and LFP (top) and MUA (bottom) in layers 2/3, 4, and 5 RVC. (B) Significant negative correlation between averaged (n = 5) CBV responses and LFP (top) and MUA (bottom) in layers 2/3, 4, and 5 LVC. (A–B) Second-order polynomial regression lines (blue) fitted using nonlinear least squares. Spearman correlation and fit coefficient given as inset in each case. Red error bars are SEM. Confidence intervals omitted for clarity.

