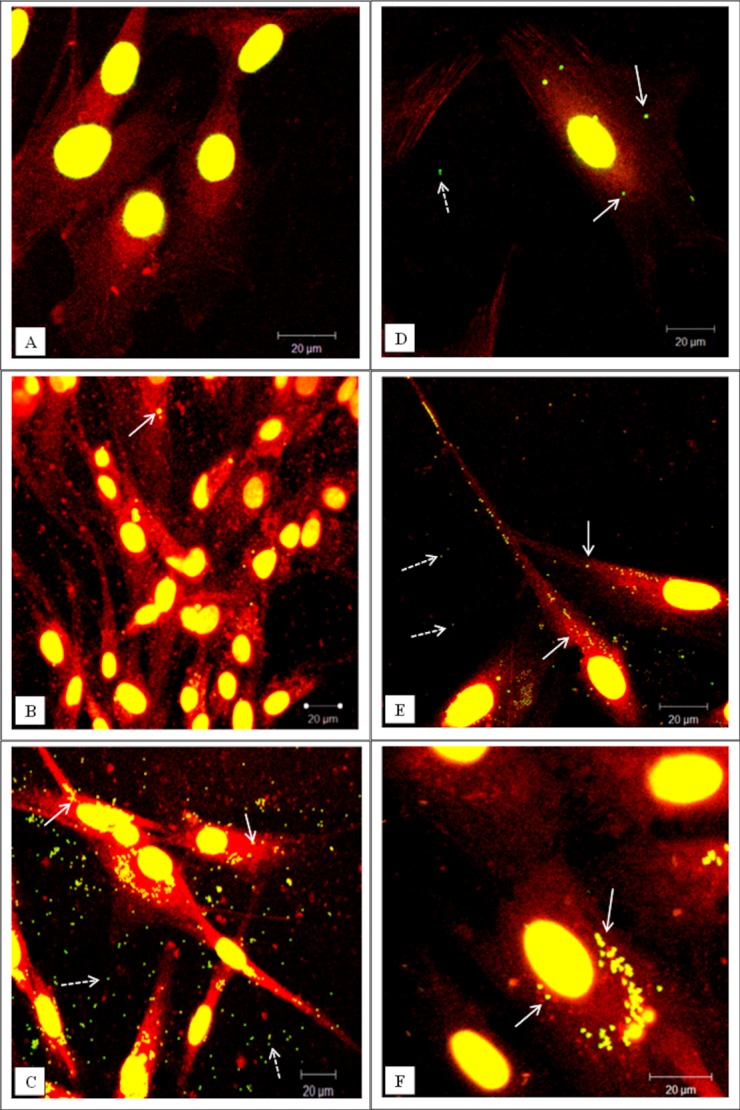
Figure 3.

Representative confocal microscopy images of cells exposed to green fluorescent microspheres (1 µm in diameter). (A–C) Dural epithelial cells. (D–F) Dural fibroblasts. (A, D) Cells exposed for 1 day. (B, E) Cells exposed for 2 days. (C, F) Cells exposed for 3 days. White arrows indicate particles internalized whereas white dashed arrows indicate particles outside the cells. The actin filaments were stained with rhodamine phalloidin and the nucleus with sytox green. All the images were taken at 630× magnification. In total 300 cells were imaged (three replicates × 100) at each time point. [Color figure can be viewed in the online issue, which is available at wileyonlinelibrary.com.]
