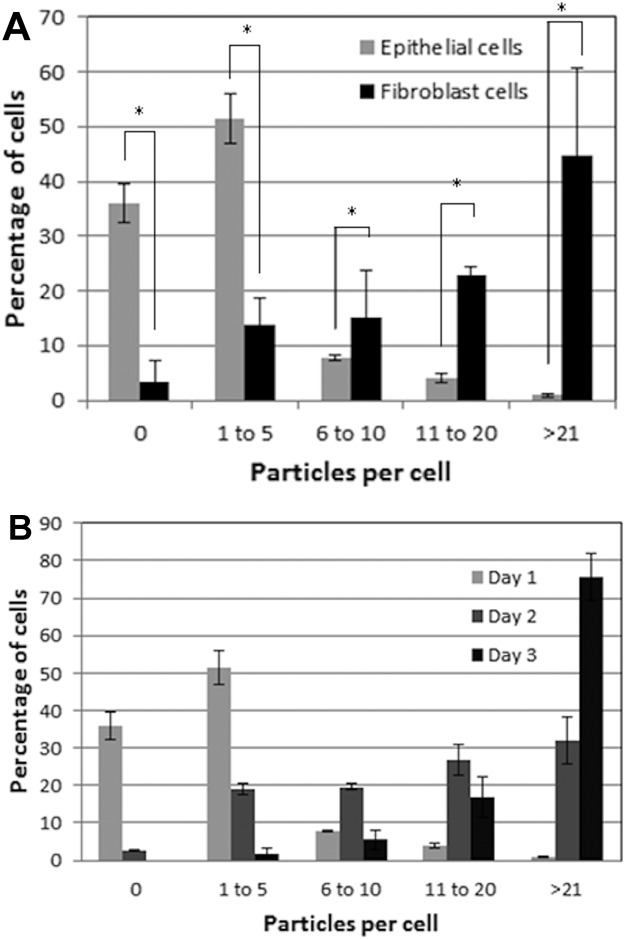
Figure 4.

Cellular uptake of fluorescent microspheres (1 µm in diameter). (A) Percentage of dural fibroblasts (gray) and dural epithelial (black) cells that had phagocytosed a given number of particles after 24 h exposure. The results were analyzed by one-way ANOVA test and the MSD calculated using the T-method. A statistical difference (p < 0.05) in particle uptake between the two group of cells, is indicated by an asterisk (*) (B) Percentage of dural epithelial cells that had phagocytosed a given number of particles after 24 h (white), 2-day (gray), and 3-day (black) exposure. Data are expressed as the mean (n = 3) ± 95% confidence limits. [Color figure can be viewed in the online issue, which is available at http://wileyonlinelibrary.com.]
