
Figure 2.
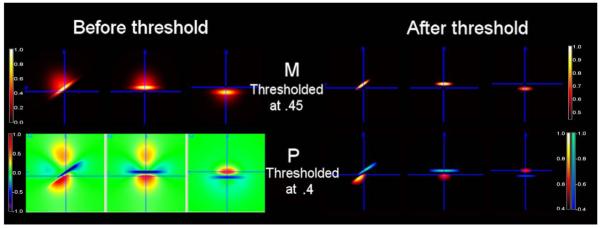
Considering the noise, the phase of quadrupolar pattern becomes bipolar for an example of asymmetric 3D Gaussian volume-averaged susceptibility change. Half of the susceptibility change has σx:σy:σz = 6:6:8 with the amplitude of 0.5 and another half has σx:σy:σz = 6:6:1 with the amplitude of 1. The total susceptibility change is rotated counter-clockwise around the x-axis by π/5.