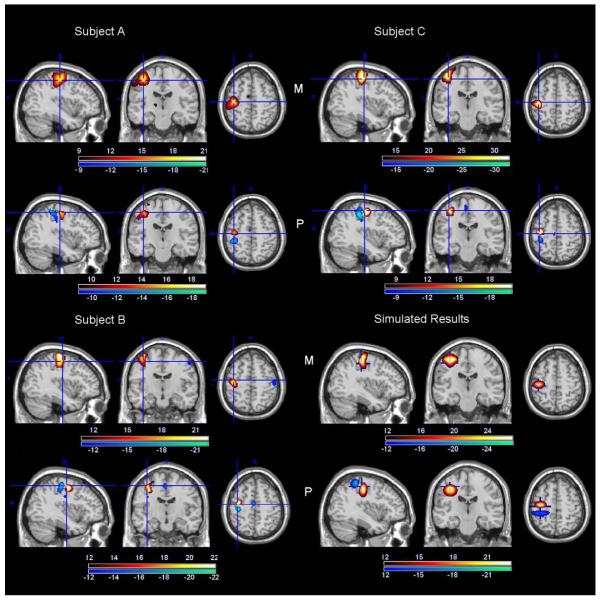
Figure 3.
Magnitude (M) and phase (P) changes (t-values) for single subject A, B, and C together with the susceptibility and phase change of simulated results. The colorbars for the subjects show the t-value ranges. The colorbar for the simulated results indicate the relative strength of susceptibility and phase change.

