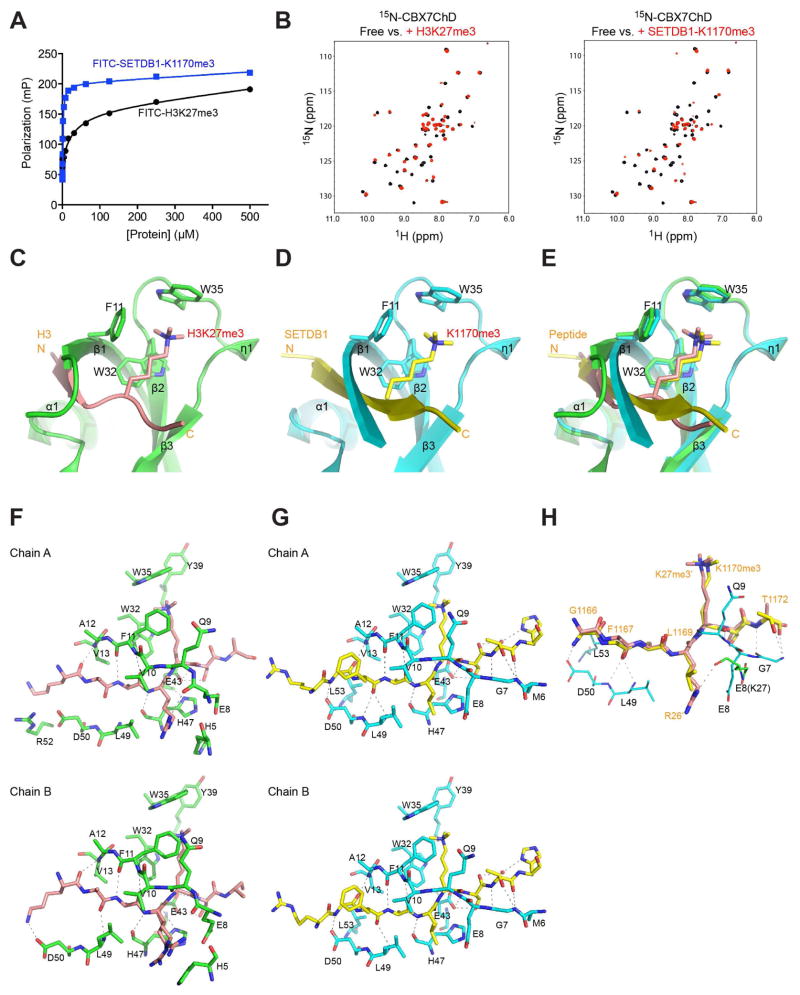
Figure 1. Structural analysis of H3K27me3 and SETDB1 recognition by CBX7ChD.
(A) Measurement of CBX7ChD binding to lysine-methylated H3 and SETDB1 peptides using a fluorescence anisotropy assay.
(B) 2D 1H-15N-HSQC spectra of 15N-CBX7ChD in free (black) or in the presence of H3K27me3 (red, left panel), or SETDB1-1170me3 peptide (red, right panel).
(C) Crystal structure of CBX7ChD bound to an H3K27me3 peptide. CBX7ChD is depicted in green, while H3K27me3 is depicted in salmon.
(D) Crystal structure of CBX7ChD bound to the SETDB1-K1170me3 peptide.
(E) Structural overlay of CBX7ChD bound to the H3K27me3 or SETDB1-K1170me3 peptide.
(F–G) Analysis of CBX7ChD bound to H3K27me3 or SETDB1-K1170me3, respectively. Only residues involved in hydrogen bond or hydrophobic interactions are shown.
(H) Comparison of SETDB1 and H3K27me3 binding to CBX7ChD.
See also Figure S1, and Tables S1 and S2.

