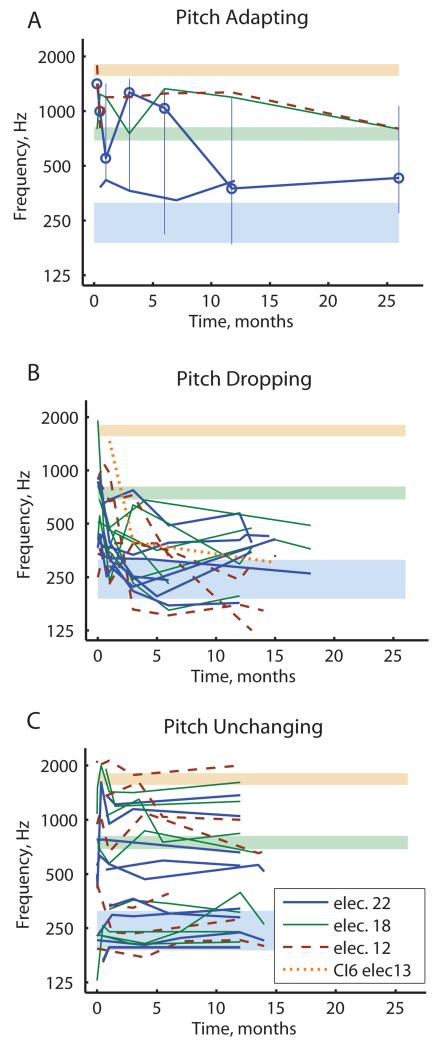
Figure 2.
Pooled population results for the PAOT subject groups tracked over time, with plots separated by pitch adaptation category. Different colors and line styles indicate different electrodes; only data for electrodes 22, 18 and 12 are shown except where indicated (see legend). Shaded regions indicate frequency-to-electrode allocations for the corresponding colored electrodes. A) Pitch-adapting subjects generally showed pitch changes in the direction of aligning with the frequency allocations (CI4 for electrode 22 and CI15 for electrodes 22 and 18), but not so much for electrode 12 for CI15. Vertical lines indicate the pitch match range for electrode 22 of CI15 (highlighted by circles) eventually overlaps with the frequency-to-electrode allocation for that electrode. B) Pitch-dropping subjects showed pitch drops for all electrodes independent of frequency allocations (CI6, CI9, CI13,CI24, CI29, CI31, CI37, CI42); note pitch drops for electrodes 18, 12 and 13 toward the electrode 22 allocation (thin green, dashed brown, and dotted orange lines, respectively). C) Pitch-unchanging subjects showed generally stable pitch for all electrodes without convergence toward frequency allocations (CI14, CI17, CI33, CI34, CI38, CI44, CI47, CI53, CI55); note that the apical electrode 22 (thick blue lines) remained high in pitch for several of these subjects.

