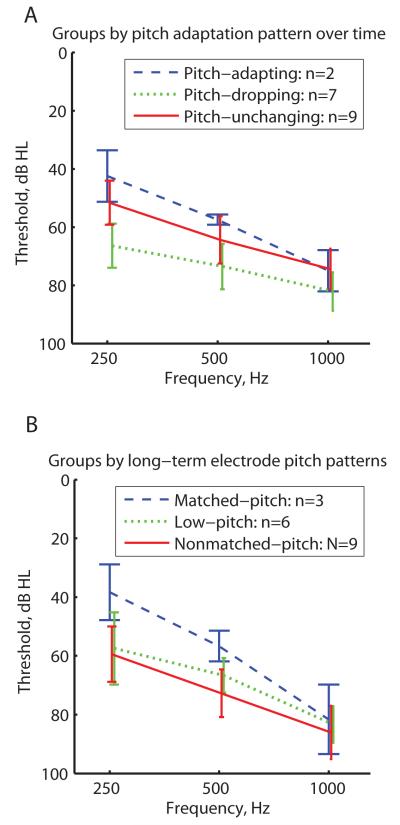
Figure 5.
Average unaided audiometric thresholds for PAOT group (A) and the ECI group (B). Audiometric thresholds were obtained at the ~12-month time point for the PAOT subjects or at the time of testing for the ECI subjects. Different colors and line styles indicate different pitch adaptation categories (see legend). A non-significant trend of better thresholds was seen for the pitch-adapting PAOT subgroup (blue dashed lines in A) and matched-pitch ECI subgroup (blue dashed lines in B) compared to the other subgroups.

