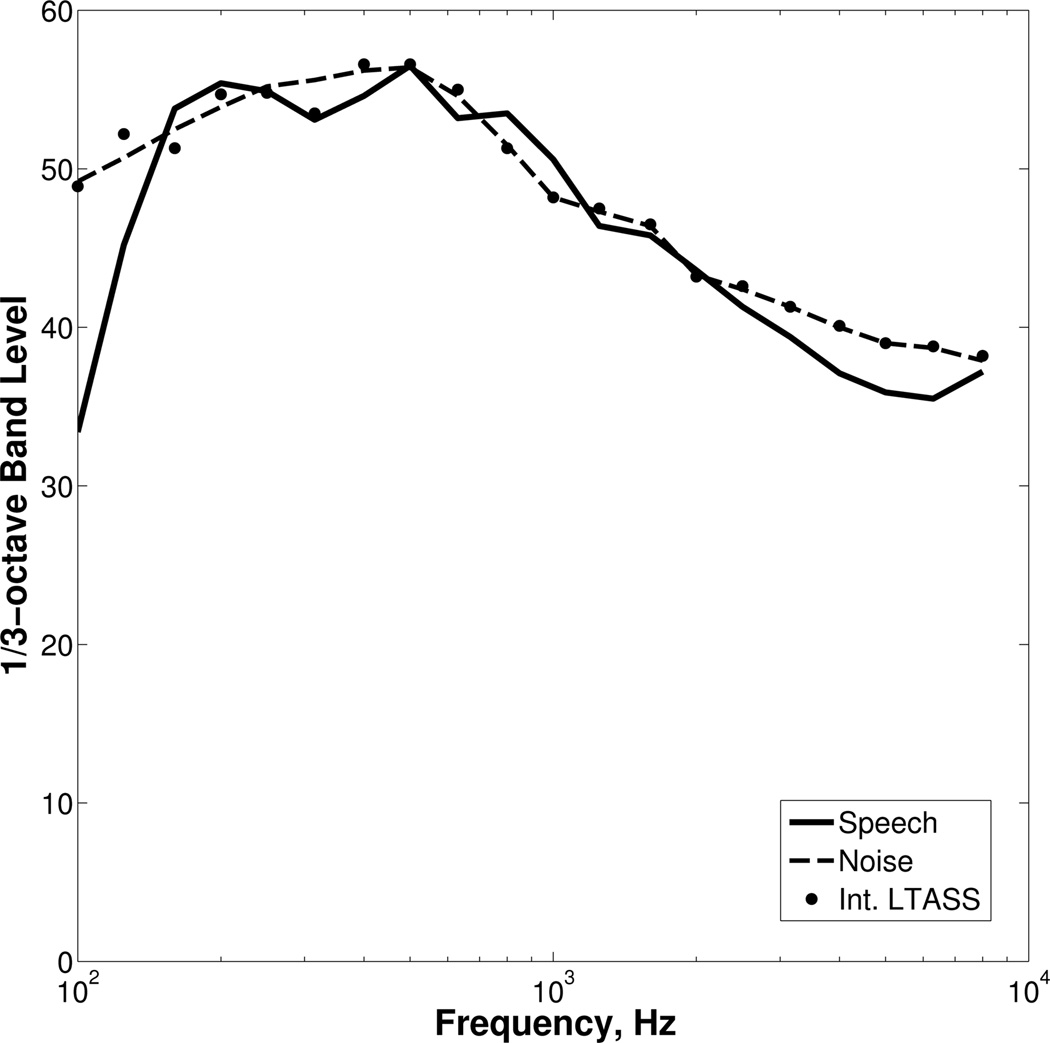
Figure 1.

Long-term average spectra of the target speech (solid line) and masker (dashed line) at 0 dB SNR, using 1/3-octave band analysis. For comparison, the 1/3-octave band levels (after scaling down 5.5 dB to align with the level of the masker at 1000 Hz) from the International Long-Term Average Speech Spectrum, LTASS, (Byrne et al. 1994) are plotted using filled circles.
