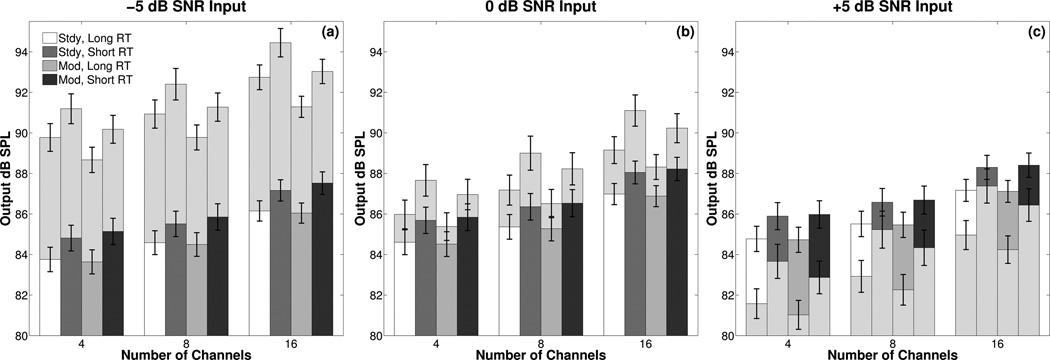
Figure 3.

Mean presentation levels in dB SPL for the speech and masker as derived from the phase inversion technique. Each panel shows results for one input SNR. Bars are grouped by number of channels. Speech levels by masker type and RT are plotted using the same shading as in Figure 2. Masker levels are plotted with the corresponding speech levels using lightly gray-shaded bars in a stacked format. In (a) and (b) the masker levels are greater than the speech levels. Therefore, the relative lengths of the lightly-gray shaded bars also correspond to the amount of negative SNR. In (c) the speech levels are greater than the masker levels, so the relative lengths of the bars for speech correspond to the amount of positive SNR.
