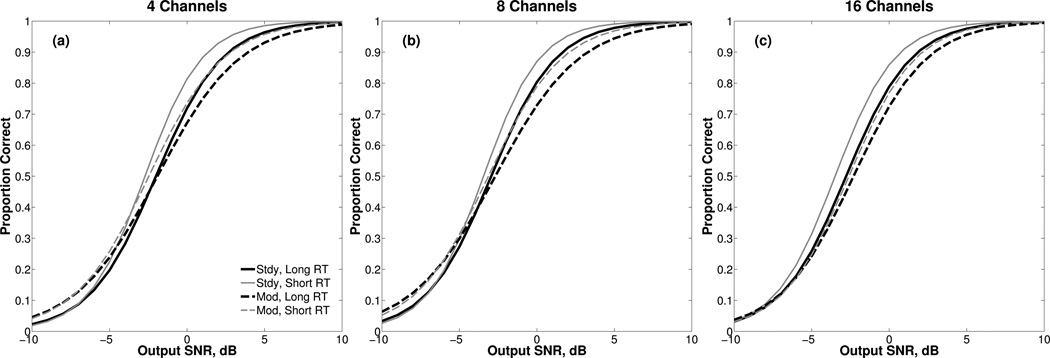
Figure 6.

Performance-intensity functions, in terms of output SNR, derived from the mean of the individual slopes and intercepts for each condition. Results for steady and modulated maskers are plotted with solid and dashed lines, respectively. Results for the long and short RTs are plotted with thicker, darker lines and with thinner, lighter lines, respectively. Results are grouped by number of channels in the different panels.
