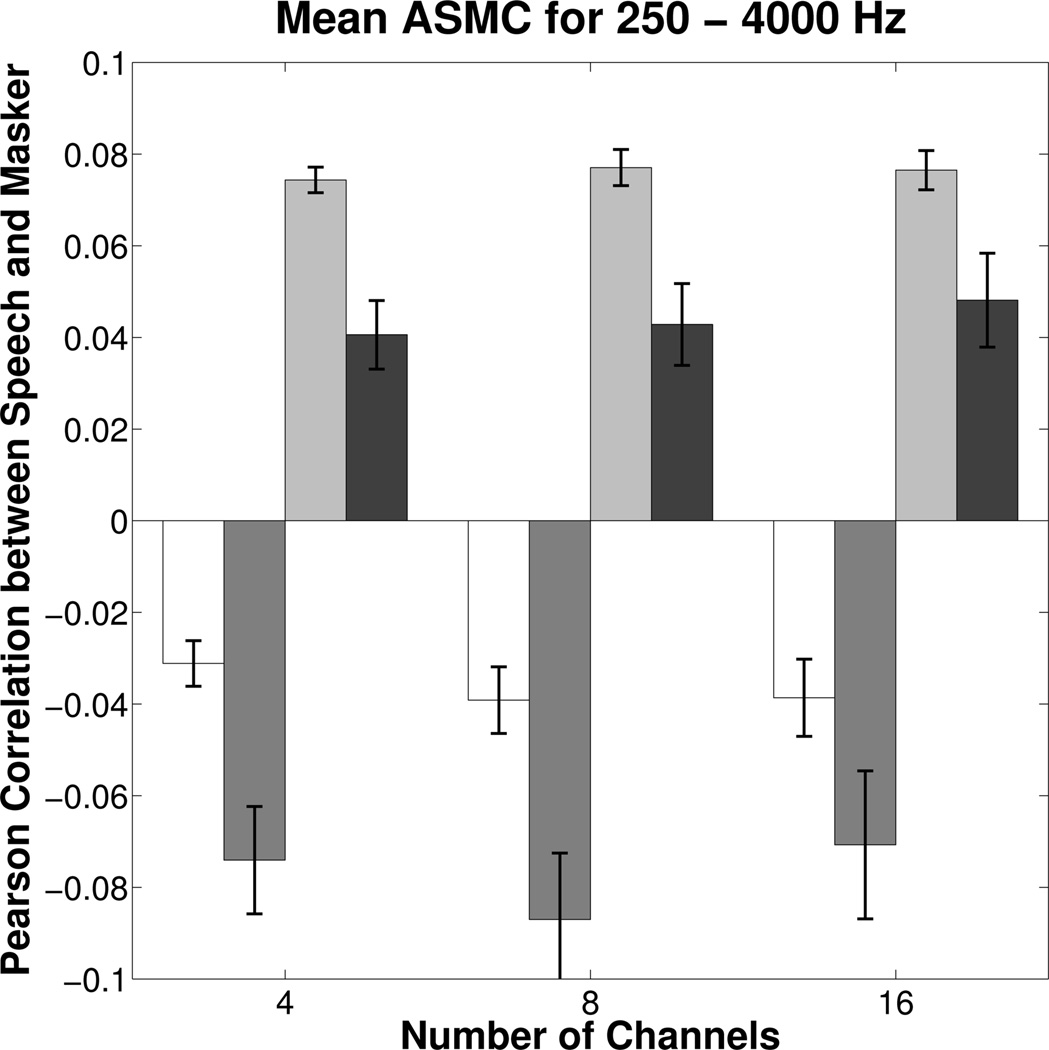
Figure 8.

Across-Source Modulation Correlations (ASMC) averaged over listeners and the 1/3 octave bands from 250 to 4000 Hz between a speech sample and masker at 0 dB input SNR. For reference, correlations of the input signals before amplification were 0.00 and 0.09 for the steady and modulated maskers, respectively. Therefore, the absolute change in the magnitude of the correlations is greater for the steady masker at each RT. The same shading as in the previous figures is used to represent masker type and RT (see also, Figure 9 legend). Error bars represent the standard error of the mean across listeners.
