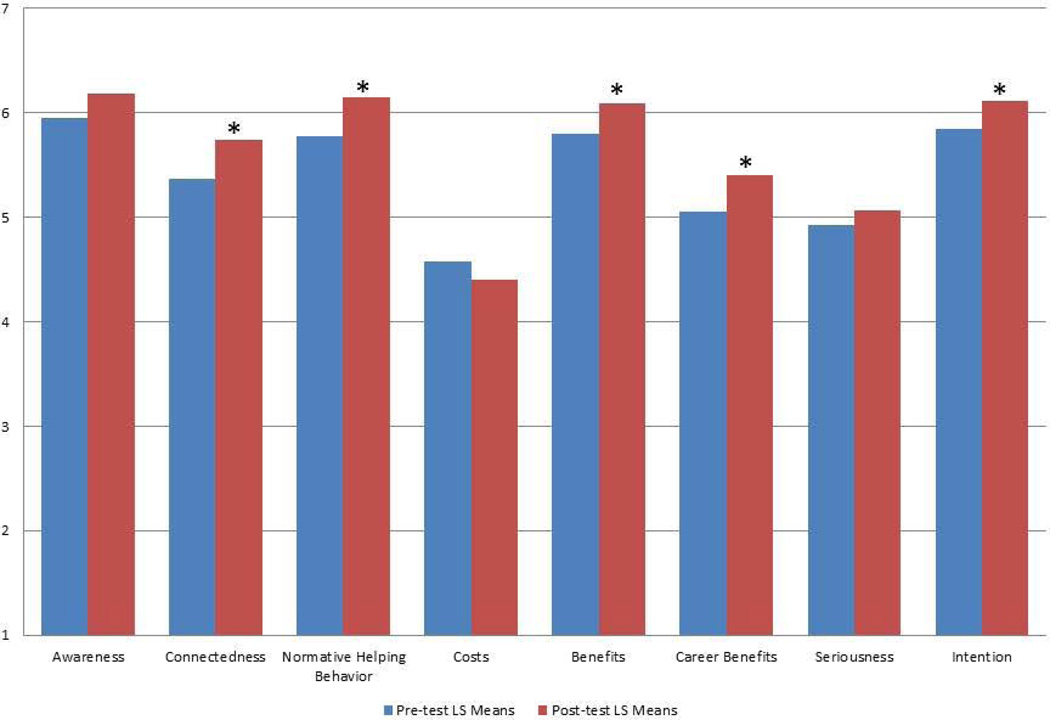
Figure 2.
Pre-test and Post-test Change (Note: 1. * denotes pre-test and post-test changes with p-value less than 0.05 2. For scales of costs, benefits, and career benefits, the vertical axis numbers correspond to anchor scales as follows. 7: Extremely likely, 6:Quite likely, 5:Slightly likely, 4:Neither likely nor unlikely, 3:Slightly unlikely, 2:Quite unlikely, 1:Extremely unlikely 3. For all other scales, the vertical axis numbers correspond to anchor scales as follows. 7: Strongly agree, 6:Agree, 5:Slightly agree, 4:Neither agree nor disagree, 3:Slightly disagree, 2:Disagree, 1:Strongly disagree).

