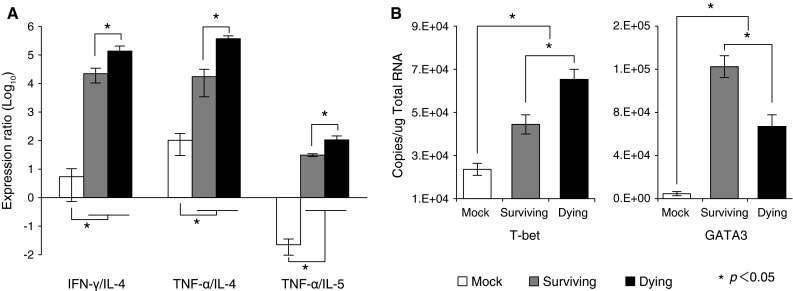
Fig. 2.

Expression ratio of Th1- to Th2-related transcription factors. (A) Ratio of IFN-γ/IL-4 (left), TNF-α/IL-4 (middle), and TNF-α/IL-5 (right) in JEV-infected mouse brain (B) mRNA expression level of Th1- and Th2-related transcription factors T-bet and GATA3. Significant differences (p < 0.05, ANOVA) between surviving and dying mouse brain at 13 days postinfection (dpi) are indicated by an asterisk (*)
