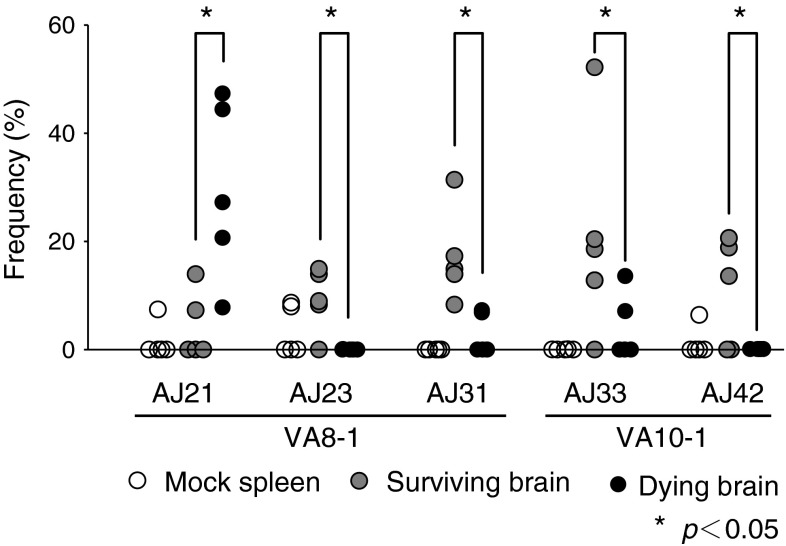
Fig. 6.
Differential patterns of TCR J gene usage between surviving and dying mice. Frequencies of characteristic V/J combinations are plotted individually. Open circles indicate spleen of mock-infected mice. Filled gray circles indicate brain of surviving mice. Filled black circles indicate brain of dying mice. An asterisk indicates a significant (p < 0.05, ANOVA) difference between the surviving and dying groups

