
Figure 5.
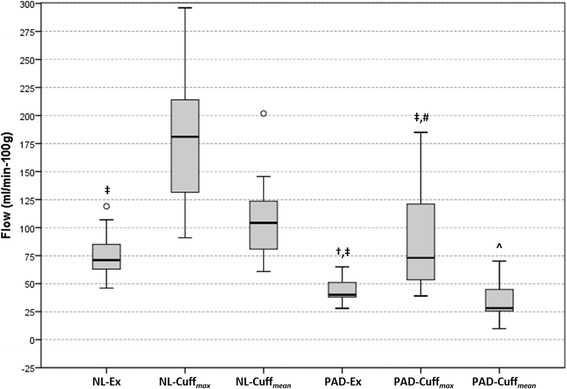
Boxplot of maximal and average perfusion. Circles indicate outliers. NL = controls; Ex = exercise hyperemia; Cuffmax = maximal post-occlusion hyperemia; PAD = peripheral arterial disease; Cuffmean = average post-occlusion calf perfusion. ‡p < 0.05 vs. Max NL-Cuff; †p < 0.05 vs. Max NL-Ex; #p < 0.05 vs. Max PAD-Ex; ^p < 0.05 vs. Comp NL-Cuff.