
Figure 2.
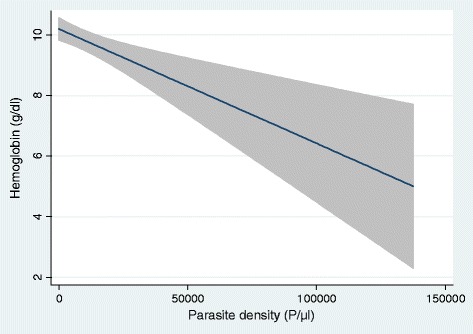
Fitted line plot of haemoglobin concentration (g/dl) according to the parasite density (p/μl) in children under the age of five in two health areas of Mont Ngafula 1, Kinshasa, DR Congo, 2012 (shaded area is 95%CI).
Official websites use .gov
A
.gov website belongs to an official
government organization in the United States.
Secure .gov websites use HTTPS
A lock (
) or https:// means you've safely
connected to the .gov website. Share sensitive
information only on official, secure websites.
Fitted line plot of haemoglobin concentration (g/dl) according to the parasite density (p/μl) in children under the age of five in two health areas of Mont Ngafula 1, Kinshasa, DR Congo, 2012 (shaded area is 95%CI).