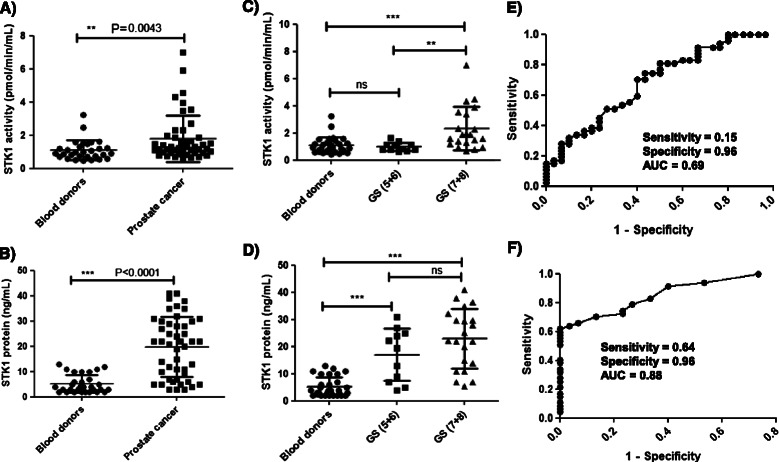
Figure 4.

TK1 activity and protein levels in sera from prostate cancer patients and blood donors. (A) STK1 activity in sera from blood donors (•) and prostate cancer patients (■). (B) Concentrations of STK1 in sera from blood donors (•) and prostate cancer patients (■). (C) Comparison of STK1 activity in sera from blood donors (•) and well-differentiated (GS5 + 6; ■) and moderately/poorly differentiated (GS7 + 8; ▲) prostate cancer patients. (D) Comparison of STK1 protein levels in blood donors (•) and well-differentiated (GS5 + 6; ■) and moderately/poorly differentiated (GS7 + 8; ▲) prostate cancer patients. The error bars denote standard deviations (SDs). (E) Receiver operating characteristic (ROC) curve of STK1 activities in sera from prostate cancer patients compared with sera from blood donors. (F) A similar ROC curve analysis of STK1 protein assay results in sera from blood donors and prostate cancer patients.
