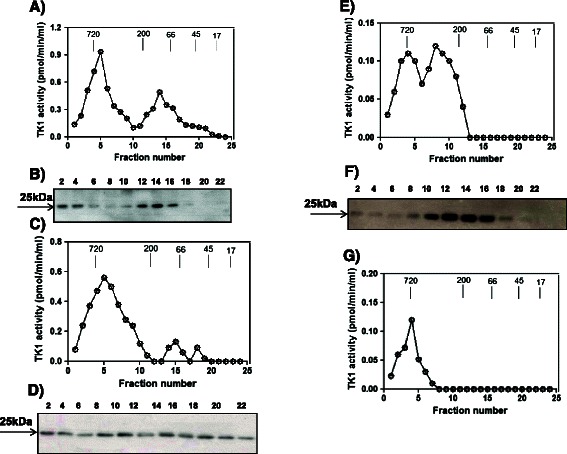
Figure 6.

Molecular forms of serum TK1 analyzed using size-exclusion chromatography. (A) Thymidine kinase 1 activity in serum fractions from an MDS patient. (B) Western blotting analysis of MDS serum fractions using the immunoaffinity method. (C) Thymidine kinase 1 activity in serum fractions from a patient with breast cancer. (D) Western blotting analysis of serum fractions from a patient with breast cancer using the immunoaffinity method. (E) Thymidine kinase 1 activity in serum fractions from a patient with prostate cancer. (F) Western blotting analysis of serum fractions from a prostate cancer patient using the immunoaffinity method. (G) Thymidine kinase 1 activity in fractions from the serum of a blood donor. The numbers denote FPLC fractions. Arrows denote the elution position with respect to molecular weight markers.
