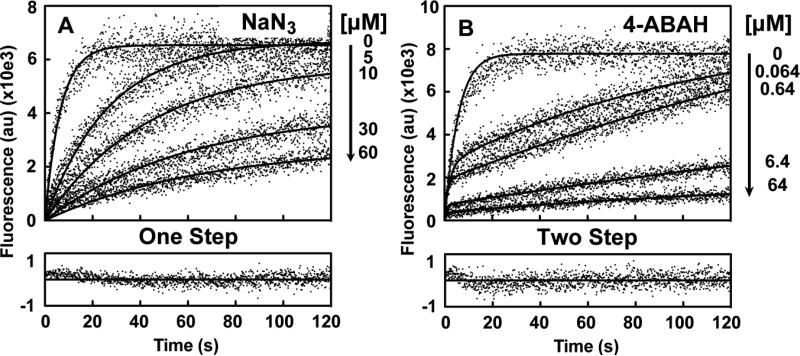
Fig. 3. Comparison of Compound I inhibition by NaN3 and 4-ABAH using simultaneous reaction modeling.
A, Fluorescence progress curves presented in arbitrary units (au) for various indicated concentration of NaN3 were globally fit to a one-step slow-tight binding model detailed in Scheme I. Representative goodness-of-fit for the 30 μM ABAH with 15 μM ADHP reaction is shown as a residual plot. B, Similar plots for 4-ABAH analyzed by a two-step slow-tight binding model (Scheme II) for indicated concentrations of 4-ABAH to accommodate the biphasic phenotypic of the reaction. Representative goodness-of-fit for 0.64 μM ABAH with 16 μM ADHP are also shown. Titrations were performed and analyzed as described under “Experimental Procedures.”

